
 The Business of Software blog has published the results of a survey of 96 microISVs:
survey results – part 1
survey results – part 2
As the survey is self-selecting it is hard to know how representative the results are for microISVs in general, but it makes interesting reading.
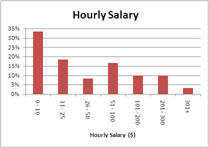
Of respondents whose microISVs had been running 6 months or more, 50% made less than $25 in sales per hour worked. Assuming modest expenses of 20% that means that the majority of microISVs are making less than $20 per hour worked, before tax. This sounds rather discouraging, but some claim to be making >$200 per hour. The author has kindly provided the raw stats for download, so I looked at them in a bit more detail. According to my quick analysis the situation is, unsurprisingly, more encouraging for established microISVs. If you take you all the respondents who have been in business at least 12 months, are working at least 30 hours per week and are making any sales at all, the average is around $60 in sales per hour worked. This is not too bad for an indoor job, with no heavy lifting, that you can do in your underwear.
The data also shows an interesting difference in sales by category. I took the data for all the 1-man companies with monthly sales >0, divided them by category and then removed the top and bottom performers in each category (to prevent outliers distorting the averages).

Average sales per hour worked ($), by category, click to enlarge
I am not surprised that the average sales is relatively low in the ‘Developer tools’ market given the fierce competition, prevalence of free tools and the effects of developer ‘not invented here’ syndrome. I am rather surprised that consumer software appears to pay better than business software. This seems to turn conventional wisdom on its head (assuming I got the numbers right, it was after midnight). Of course, sales is not the same as profit. There appears to be little (if any) correlation between the ticket price of an item and the total monthly sales.
Digging a bit further, the stats also show some correlation between marketing spend and sales:

Monthly marketing spend ($/month) vs monthly sales ($/month), click to enlarge
Of course (repeat after me) correlation does not imply causation.
Thanks to Neil for taking the time to do the survey and publish the results.

Pingback: mysoftwareonline.com » Business of Software microISV survey
That was a shock. I would have bet that business software was more profitable, and I consider myself a strict non-gambler.
From the spending chart, it looks like I’m doing fairly well with my spend vs. sales. Nice to know.
Thanks for posting that.
I trust your computational skills but I don’t trust your math ;) I’ll explain the reason after I go home for the day and have a chance to do some data slicing. (This again makes me wish I had ever bothered to learn excel. My typical method is exporting the data to CSV and then hitting it in Ruby or Gawk. I know there must be a better way…)
Pingback: FollowSteph.com » Quick Links
Pingback: Why You Shouldn’t Pay Any SEO You Can Afford « MicroISV on a Shoestring