Category Archives: marketing

AdWords Rot

Adwords RotAn AdWords account that starts off making a worthwhile profit for the owner is often neglected and, within a year or two, is losing money. Potentially a lot of money. I have seen it happen again and again. If you are running a Google AdWords campaign, you have to at least monitor it. Better still, actively maintain it. Otherwise the rot will soon set in.

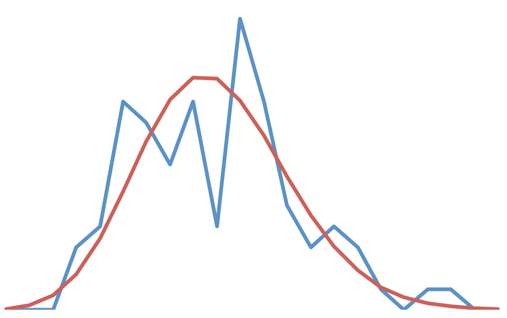
Here is an example of an AdWords campaign that was professionally set up and then left to coast, unmanaged. You can see that the cost per converted click (blue) rose, while the number of conversions (orange) fell a little. The average cost per conversion (trial) rose by a factor of 3 in just 4 years. What was once a profitable account was now wasting a lot of money. Ouch.

adwords conversion graph 2

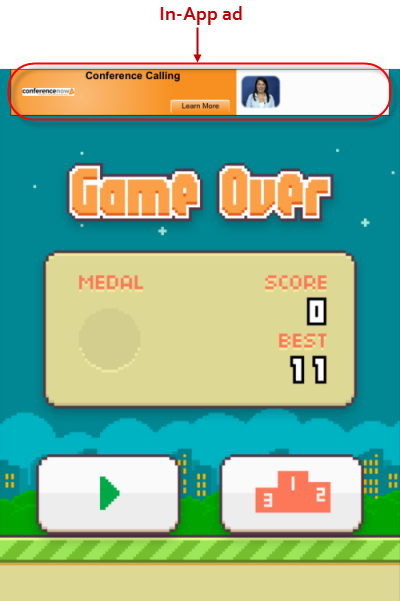
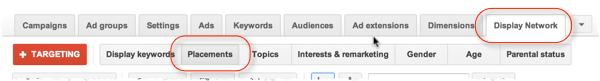
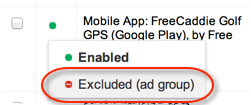
The main reason for the rot is that Google are continually changing AdWords, and they may opt you in to new features without asking you. For example they automatically opted display advertisers into showing ads in free-to-play AppStore games. B2B business owners were paying thousands of dollars for clicks made by bored children in Flappy Bird and the like. I have seen accounts where thousands of dollars have been spent on these worthless clicks. And these were  small companies. Other reasons include:

  • Your display ads might start showing on a new website where they convert badly.
  • Poor targeting. Perhaps a new product, film or band has appeared with a name similar to your product.
  • Increased competition and bid price inflation can reduce a healthy amount of traffic to a trickle, reducing profitability.
  • Click fraud.

So you really need to keep an eye on your AdWords account. At an absolute minimum you should monitor the number of conversions and the cost per conversion and investigate any unfavourable changes. To keep your account in good shape over time you need to actively maintain it, e.g.:

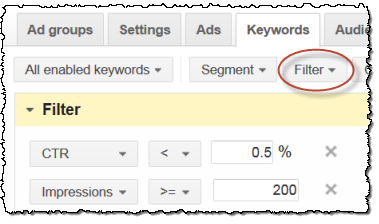
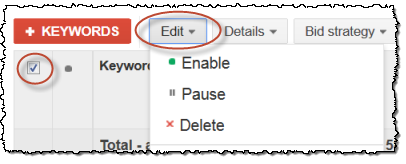
  • Delete any keywords with poor click through rates (typically I delete keywords with a CTR of 0.5% or less after 200 or more impressions).
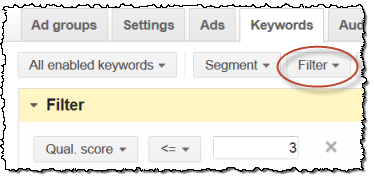
  • Delete any keywords with poor quality scores (typically I delete keywords with a QS of 3 or less).
  • Delete any keywords or ads with poor conversion rates.
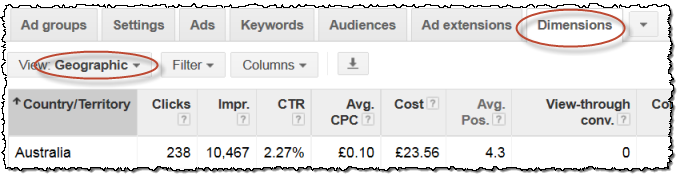
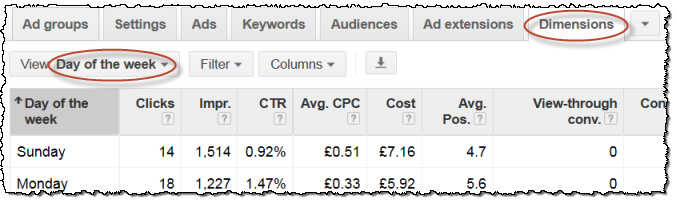
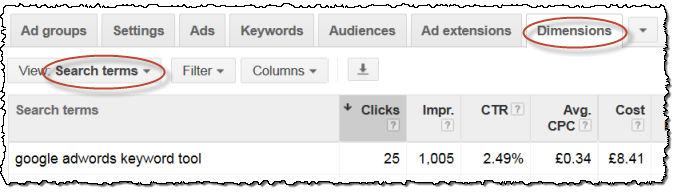
  • Examine the dimensions>search terms report for negative keywords to add.

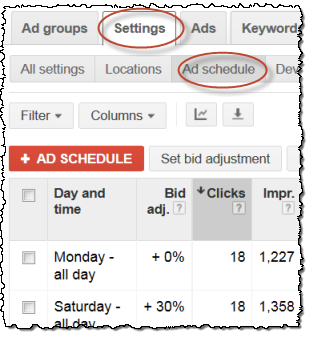
You can easily set up filters and get automated reports sent to you to make this fairly painless. These checks should be done perhaps once a week for a new or high budget campaign and perhaps once a month for a mature or low budget campaign. You can also make your life easier by setting up AdWords so that Google is doing most of the heavy lifting for you. For example you can use CPA bidding and you can set the ad rotation setting to Optimize for conversions: Show ads expected to provide more conversions.

A mature account that has been well set-up and has a budget of around $1k per month, probably only needs an hour a month to maintain. Alternatively, if you can’t spare an hour or two a month to manage your AdWords campaign, do yourself a favour and shut it down. Now.

Remarketing – does it work?

remarketingIf you go to Amazon and browse watches, you will suddenly notice a preponderance of watch ads everywhere you go on the Internet. This is ‘remarketing’ (also known as ‘retargeting’ or, more colloquially, ‘cyber stalking’). Wikipedia defines it as:

a form of online targeted advertising by which online advertising is targeted to consumers based on their previous Internet actions, in situations where these actions did not result in a sale or conversion.

Given that:

a) It is hard work to get potential purchasers to visit your website

b) some 99% of visitors to a typical website leave without buying anything

It seems to make sense to spend some time and money reminding non-purchasers to come back to your website in the hope that they will eventually purchase.

The basic mechanics of remarketing are:

  1. Sign up with a remarketing publisher such as Google, Perfect Audience or Adroll.
  2. Upload some graphical ads.
  3. Bid to show these ads on other sites.
  4. Add a script on your site which cookies visitors for remarketing.
  5. When your visitor leaves your site and goes to another site in the remarketing publisher’s network, the remarketing cookie is read and an ad is shown (or not, depending on how much you and other advertisers are bidding per impression).
  6. Hopefully people will see your ad, click through and buy your product. Or they may just be reminded to continue the trial, without clicking the ad.

A number of people I have spoken to told me it was very cost-effective. But when I asked how they knew that these remarketing conversions wouldn’t have purchased anyway, I didn’t get a satisfactory answer. It seems straightforward enough to test this: run an A/B test, showing remarketing ads to 50% of your visitors and see what difference it makes to conversions. But an online search and some asking around turned up very little data. The one decent study I found quoted an 18% increase in conversions (yes please!), but was for an ‘e-commerce website’. So, dear reader, I have done the experiment using Perfect Audience for remarketing, Visual Website Optimizer for A/B testing and my table planner software as the subject. Here are my results:

visits sales conversion
rate
Control (No
remarketing )
10,539 162 1.54% (±0.15)
Remarketing 11,137 174 1.56% (±0.15)

So the remarketing showed an increase in sales of 1.6% over 21,676 visits and 336 sales. However it is noticeable that the 95 percentile error bars are rather large compared with the conversion rates. I am only 95% sure that the conversion rates are in the range 1.69% to 1.39% (control) and 1.71% to 1.41% (remarketing). Which means the change in conversion rate could be anything from +23% to -19% (but given normal distribution curves, most likely somewhere in the middle). According to Visual Website Optimizer, we can only be 56% sure that the increase in conversions is a real effect, and not just a statistical anomaly. The graph below shows the convergence of the conversion rates over time (blue is the control, orange is with remarketing).

remarketing experimentIt gets worse when you factor in the cost of the remarketing. I know the value of the sales and the cost of the ads over the period of the experiment. So I can work out that for every $1 I spent on remarketing I was getting around $0.95 back in extra sales. It isn’t looking like a winner for me, especially when you factor in the time taken to set-up and administer it.

Some points to note:

  • Remarketing resulted in 1.8% less installs than the control. This is probably just a statistical anomaly (67% chance of being statistically significant).
  • I choose Perfect Audience based on the recommendation of Rob Walling, who has experimented with Google, Adroll, remarketer.com and Perfect Audience. Unlike Google, Perfect Audience allows remarketing across a wide range of platforms and websites, including Facebook and Twitter. I found their system to be relatively flexible and easy to set-up. But being billed weekly is a bit tedious for my bookkeeper.
  • I showed my ads on Facebook and various websites. I didn’t show them on Twitter as my previous experiences with advertising on Twitter haven’t been great.
  • With remarketing you pay per impression, not per click. I set my CPM (cost per thousand impressions) relatively low. I ended up averaging $1.55 for web ads and $1.14 for Facebook ads.
  • Click through rates were miserable, averaging just 0.051% for both web and Facebook ads.
  • The average cost per click was $2.58. This is a lot more than I pay per click on Adwords.
  • I remarketed to people that arrived on my home page. I stopped targeting them after 30 days or after they had purchased.
  • I didn’t remarket to visitors from developing countries, as they very rarely buy my software. Had I remarketed to visitors from every country the remarketing conversion rate would probably have been slightly higher, but the ad costs would have been significantly higher.
  • I didn’t get any complaints from customers about being ‘stalked’.
  • I just knocked up some ad graphics myself (examples below). I got the idea for an attention-grabbing ugly ad here. It didn’t perform well though.

buy_image_ad_300x250

ugly handwriting 300x250 3I probably could probably improve the ROI on remarketing with some experimentation. E.g.:

  • Trying professionally designed ads.
  • Trying different bids.
  • Experimenting with only showing ads to people who have installed the trial vs only showing ads to people who haven’t installed the trial.

But it doesn’t really seem worth the opportunity cost given the results to date.

Of course, my experiment is just one data point. Remarketing might work better for you if you have a higher average lifetime value for a customer (many of my customers buy the $30 version of PerfectTablePlan for their wedding and never purchase from me again). If you have a B2B product with an average lifetime value in the hundreds or thousands of dollars, it is probably worth a try. You will have to run your own A/B test to find out. If you do, please let me know what the results are.

My new product : Hyper Plan

scrum kanban
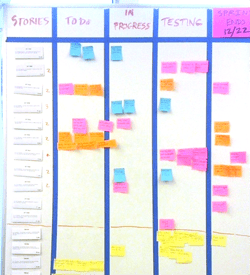
I have just launched a new product. First some back story. A few years ago, my wife and I were renovating the house we live in now. Trying to schedule and track all the different tasks, tradesmen and quotes was a real pain. We stuck Post-it® notes onto a whiteboard to try to keep on top of it all. The Post-it notes represented the various jobs that need doing. We placed them in columns (representing what stage they were at: needs quote, accepted quote, scheduled, doing, done) and rows (representing the various trades: plumbing, roofing, electrical etc). It worked, but it was far from ideal:

  • I wanted to see status vs trade, status vs room and room vs trade. But changing the layout was a pain, so I had to pick one layout and stick with it.
  • Colours were useful for extra information. But we were limited to just the few colours that Post-it notes come in.
  • There was only limited space to write on the note.
  • My wife couldn’t read my handwriting.
  • We had to use a separate spreadsheet to track the budget.
  • Post-it notes would fall off and get lost after being moved a few times.
  • I ran out of Post-it notes.

That is when the idea of Hyper Plan first occurred to me. It has been burning a hole in my brain for the last 5 years. Now I have finally got around to implementing it.

Hyper Plan is Post-it note style planning, implemented in software. In software you are no-longer limited by the number of Post-it notes you can afford, the amount of wall space you have or the number of colours Post-it notes come in. You can even change the layout and colours with a mouse click. All with animation and easing curve loveliness.

The sorts of planning you can use it for include:

  • project planning
  • planning what is going into your next software release
  • event planning
  • Kanban / Scrum / Agile
  • planning a holiday
  • to do list (I know!)

Anything where you have discrete tasks that you want to be able to categorize (e.g. by person, status or type), schedule or track in a visual form.

Here is a 2:42 minute overview in video form (with audio):

Hyper Plan videoCan’t see the video? Try this mp4 version (10.7 MB).

Hyper Plan is quite different to anything else I have seen. That could be a good thing or bad thing. I am putting out an early beta to try to find out.

Hyper Plan is not currently for sale. I don’t want to take the time to set up all the payment processing and licensing until I am confident someone might actually buy it. The current beta version will run completely unrestricted until 17-Jan-2015. There are Windows and Mac versions. Hopefully a commercial version will be available for sale by the time the beta expires. If not, I will release another free version.

Currently it is very much an MVP (minimum viable product).

  • The UI is a bit rough around the edges.
  • The logo was done in 5 minutes in Word.
  • The documentation is just a quick start guide.
  • Some important features are not implemented yet (e.g. printing, exporting and undo).

But I have tried to follow my own advice and resist foul urges to spend months polishing it (which is hard!). What is there is pretty robust though, and I think it demonstrates the concepts. Hopefully I will know in a few weeks whether it is worth taking the time to polish it to commercial levels.

I would love to know what you think. Particularly how useful you find it for ‘real’ planning tasks. Even responses of the form “I wouldn’t use this because…” are helpful. Please also email a link to anyone else you think might be interested. Particularly if you have ever seen them sticking Post-it notes to a wall or swearing at Microsoft Project! My contact details are here.

buttonFAQ

Q: Why is it desktop, rather than SaaS/mobile?

A. I think stories of the death of desktop software are exaggerated. Also:

  • I can build a minimum viable product much quicker for desktop.
  • Differentiation. Some people prefer desktop apps, e.g. because they don’t have reliable Internet or don’t want to store their data on third party servers.
  • Less competition. Everyone else seems to be doing SaaS/mobile.

I might add SaaS and/or mobile versions later, if there is enough demand. Note that DropBox (or the Google, Microsoft or Apple equivalents) allow you to easily sync a Hyper Plan file across multiple computers.

Q: So it’s Trello for desktop?

A. Not really. I had the basic idea before I ever saw Trello. And I’m not stupid enough to compete with a free tool from the great Joel Spolsky! Trello is great at what it does. But Hyper Plan is different in quite a few ways. In Trello the emphasis is on collaboration and workflow. In Hyper Plan the emphasis is on visualization and planning. Hyper Plan allows you to present your information in lots of different ways with a few mouse clicks. It also has a built in ‘pivot table’ type feature that is much easier to use than Excel pivot tables. This is really useful for totalling effort and expenditure by different categories.

Post-it is a registered trademark of 3M.

The scrum photo is licensed under creative common by Logan Ingalls.

2 Million Hits!

This blog just passed 2 million hits since I started back in the dim and distant Internet past of 2007 with How much money will my software make (and what has that got to do with aliens)?. Wow.

I haven’t been posting much recently, but I haven’t given up either.  Watch this space. Until then, here are the top 10 blog posts to date:

Post Hits
The software awards scam 265,427
Lessons learned from 13 failed software
products
82,088
10 things non-technical users don’t
understand about your software
78,561
Your harddrive *will* fail – it’s just a
question of when
54,775
Where I program 53,910
If you aren’t embarrassed by v1.0 you didn’t
release it early enough
41,531
SWREG customers beware 36,691
The 1% fallacy 35,327
The world’s fastest Rubik cube solver is
made from Lego!
30,662
The brutal truth about marketing your
software product
29,104

Are you wasting your AdWords budget on in-app ads?

2 out of the last 3 AdWords campaigns I have looked at for consulting customers were spending substantial amounts of money on worthless in-app ads, without even realising it. Feast your eyes on the following:

in-app placement ads$1,071.04 spent on clicks from a single game app, that resulted in 0 trials of the software product being advertised. Hardly surprising given that it was a B2B app that cost around $1000. On further investigation this company was spending a substantial percentage of its AdWords budget on completely useless clicks from in-app ads. Ouch.

And this is from a different AdWords account for another B2B software company:

in-app display ads

Many of the apps in the iOS and Android app stores are now funded by in-app advertising. The creator of the infamous Flappy Bird game claimed to be making tens of thousands of dollars per day like this.

Flappy Bird In-App ads

(Note that the ad shown in the screenshot is not related to either of the two companies I mentioned above).

At least the ad is well away from the ‘play’ button. Some, less scrupulous, app makers place the ad in such a way that it is easy to accidentally click on it.

Who would want to pay for in-app ads, knowing that most of the traffic will be accidental clicks from frustrated gamers (many of them children) just trying to get to the next screen? If you run ads on the Google display (content) network, it might be YOU. Google started showing display ads in apps some time ago and it seems that all existing display campaigns were automatically opted in. Worse still, the apps they are advertising in appear to have no relevance at all to your content campaign keywords.

App makers get some money, the public gets free apps and Google makes mega bucks. The advertiser is financing the whole thing and getting (in many cases) nothing in return. But don’t feel too smug. If you have a display campaign that you aren’t carefully monitoring, you might also be throwing away money. To find out:

  • Log in adwords.google.com.
  • Click on All online campaigns.
  • Choose a sensible time frame, e.g. the last 6 months.
  • Click on the Display network tab.
  • Click on Placements.
  • Click on the Cost column to order from highest to lowest cost.
  • Look down the Placement column for entries that start with Mobile App.

Adwords display placements report

While you are there, it is also worth checking the relevance to your product of the other sites you are running display ads on.

Hopefully no horror story awaits you. If it does, you can exclude the offending placements to stop your ads appearing there again.

exclude AdWords placement

But this is a bit like playing whack-a-mole, as you will be continually excluding new apps (I haven’t found a way to opt out of in-app ads wholesale). Alternatively, just pause your display campaigns. Personally I gave up on display ads some time ago. The conversion ratios were so miserable (much lower than search ads) that I could never make any money on them.

If you have been stung for hundreds or thousands of dollars, it may be worth complaining to Google, to see if you can get any money back on the grounds:

  • You never explicitly opted in to in-app ads.
  • The apps your ads appear in bear no relationship to the search terms in your content campaign.

I have no idea if that will be successful, but it might be worth a try.

Google are continually changing the rules of the AdWords game and you would be naive to assume they are doing so with your best interests at heart. If you are running an AdWords campaign you must monitor it continuously or bad things will happen.

Related articles:

Why have my sales dropped?

why have my sales dropped?If you spend as much time as I do hanging around forums for independent developers, you will often see questions of the form “I only made X sales today/this week/this month, has something gone wrong?”. There are two distinct possibilities:

  1. Something has changed (e.g. your website is broken); or
  2. It’s a statistical fluctuation.

Rather than guessing, we can use some stats to work out the probability that a drop in sales is just a random fluctuation.

The Poisson distribution gives us the probability of a given number of discrete events occurring in a fixed interval of time (or space), if these events occur with a known average rate and independently of each other. It can be used to investigate the accuracy of v1 flying bombs, the number of 19th century Prussian soldiers kicked to death by horses and the number of South Africans attacked by sharks. It can also be used to calculate the probability of getting <= n sales per day/week/month, if we average N sales per day/week/month.

Poisson distribution

A comparison between the number of PerfectTablePlan sales per day over 90 days (blue histogram) vs predicted by the Poisson distribution (red histogram). We would expect the prediction to become more accurate with more data, assuming nothing else changes. Obviously things do change over the lifetime of a software product, hence the relatively short time span chosen.

Using this online Poisson distribution calculator we can work out some example probabilities:

expected
number of sales
over period
Probability of drop in sales of: 5 10 50 100
>= 20% 44% 33.3% 8.6% 2.3%
>= 40% 26.5% 13% 0.2% 0%
>= 60% 12.5% 2.9% 0% 0%
 = 100% 0.7% 0% 0% 0%

(0% = too small for the calculator to display)

For example:

  • If we average 5 sales per week, the chance of a 40% or more drop in sales (i.e. a week with 3 or less sales) is 26.5%.
  • If we average 50 sales per week, the chance of a 40% or more drop in sales (i.e. a week with 30 or less sales) is 0.2%.

So the less sales we make (or the shorter the period we look at), the bigger the random fluctuations we can expect. If I was averaging 5 sales per week, I wouldn’t be too worried about a drop of 40% in sales for one week. In fact, I would expect it to happen approximately one week in every 4 (running a business that averages 5 big B2B sales a year, must be very stressful!). But if I was making 50 sales per week, a 40% drop in sales should only happen by chance approximately once every 10 years. I would definitely check for other causes.

Assuming it isn’t just a statistical blip, the most likely cause of non-random change is an issue with your website. Rather than waiting for a problem, I suggest you set up continuous monitoring that emails or SMSs you if a problem occurs. There are various services for this. I use free pingdom.com and siteuptime.com accounts. Using 2 different services protects you against one of them silently failing.

If your website is up, what else have you changed recently? Check your analytics for changes and your Google webmaster tools account for warnings. Has traffic dropped (perhaps you been slapped by Google)? Has the number of downloads/trials dropped while the traffic stayed the same (perhaps there is a problem with downloading/signing up)? If you have made a new release, double check there are no major bugs in the installer or software. “It works on my development machine” doesn’t cut it with customers, so check it on a non-development machine or a clean VM.

Don’t assume that random strangers on the Internet will email you to tell you that something is broken. Perhaps 1 in a hundred or a thousand will. The rest will just click the back button. You can improve your odds by having loyal and engaged customers and a clearly displayed email address and/or phone number. But still don’t depend on it. When is the last time you noticed an issue on a website and took the time to report it?

Also some seasonal variation in sales is likely. The pattern depends on your market. Many businesses see a drop in sales in the northern hemisphere summer. But my wedding table plan software sells better in the summer. Hopefully you will know the pattern for your product after a year or two.

Random fluctuations and the lack of visitors to report issues means that it is hardest to tell whether a drop in sales is real when you start out. This is  when you need the sales most, both financially and emotionally. It gets easier as your traffic and sales improves. No one said that life was fair.

Training course update

I ran my second ‘Start your own software business’ course over the weekend of 22/23 March. Here is what some of the attendees had to say:

“I thought I knew most things about setting up and running an ISV but Andy filled in all the gaps and taught me stuff I hadn’t even thought about! I would, without hesitation, recommend this course (which is great value) to anyone thinking of starting a small software company or even an existing company that wants to ensure they give their business the best chance for success. Well done Andy!”
Anonymous (gainfully employed)

Roger Pearson“PC Pro magazine (not easy to impress) gave PerfectTablePlan a glowing review. That gives you some idea of Andy’s talent for programming and marketing. His weekend training program allows the attendees to garner his expertise for themselves and their software projects. Andy knows his subject – his experience is extensive, practical and hard-earned. I have run 2 successful small software business in the past. By attending his course I wanted to find out from someone who was actually doing it today, how I could apply techniques and best practice to my next software project. Did I succeed? Without a doubt. Andy was meticulous in his planning of the event and thorough in his presentation. I couldn’t ask for more. Top marks. I recommend Andy’s course to anyone venturing into the world of running a small software business.”
Roger Pearson

Derek Ekins“I recently attended Andy Brice’s “Start your own software business” course. Andy teaches some very practical skills to evaluate your idea, find if there is a market and launch your product. Behind most of the topics Andy had a story of how this particular lesson was learnt and how he has successfully implemented it. I now feel I am equipped with some practical knowledge of how to launch a software product. Thanks Andy.”
Derek Ekins

I will be following all their progress with interest.

I hope to run the course again in 2014. If you are interested in attending, please fill in the form on the training page.

Twitter Demographics Are Bullshit

twitter demographicsI have been experimenting a bit with promoting my software using promoted tweets. You can target people based on their interests or the Twitter handles they follow. I have chosen the latter approach with the aim of getting people to a) click through to my website and b) retweet (in the hope of more click throughs).

The results haven’t been great, with only 25% of the ‘engagements’ I paid for resulting in clicks through to my website. Here is a direct comparison between traffic from AdWords and Twitter ads to my seating planner software website (data from Google Analytics).

AdWords search
campaign
Twitter sponsored
tweet
Bounce rate 43% 78%
Av. pages visited 3.10 1.48
Av. time on site 1:51 0:40

Ouch. Then factor in that the Twitter traffic cost me 2.5 times as much per click through as the AdWords traffic. Double ouch. But that’s fine. You have do lots of experiments to find out what works. Most of them won’t be successful. This experiment only cost me £150.

However I was a bit puzzled by the ‘interests’ report from Twitter. Here are the top 10 ‘interests’ of the people that were shown my sponsored tweet, as reported by Twitter ads.

twitter demographicsBear in mind that I was targeting various Twitter handles related to the events and wedding industry for Twitter users in the UK, USA and Canada. According to the report:

  • 72% of them are interested in ‘Politics’.
  • 69% of them are interested in ‘Hip hop and rap’.
  • 62% of them are interested in  ‘NFL football’.
  • ‘Weddings’ is way down the list at number 55 with 15%, between ‘Leadership’ and ‘Dogs’.

Hmm, something is a bit fishy here.

I ran some more campaigns to promote my UK training course for people who want to create commercial software products. The ticket price for my course is higher than for my seating planner software, so I thought it was worth persevering a bit more with Twitter ads. Here are the top 10 ‘interests’ for the 3 campaigns I ran.

twitter demographics twitter demographics twitter demographicsBear in mind that this time, I was targeting various Twitter handles related to software development, marketing and entrepreneurship for Twitter users in the UK. We love our comedy in the UK and most of us could stand to lose a few pounds. But I can confidently state that the vast majority of people in the UK know almost nothing about NFL (American) football and care even less. ‘Computer programming’ and ‘Startups’ were waaay down all 3 lists.

Twitters says:

We infer interest from a variety of signals, like the accounts users follow and the Tweets they engage with.

I emailed them to point out that the interests seemed to be highly suspect, but I didn’t get a substantive reply.

I can only conclude that either Twitter isn’t doing a very good job of the targeting or (more likely) it really doesn’t understand the interests of its customers and is doing a very poor job at guessing. Consequently I would urge you to be very wary of paying for promoted tweets on the basis of ‘interests’.

5 things you can do to improve your AdWords profitability in the next 30 minutes

Lots of people set up AdWords campaigns and then leave them to run unattended for months at a time. Bad. Idea. I know, I know, you’ve got a million other things to. So I am going to give you a very short and very specific list of things you can do to improve your AdWords account. Right now. No excuses.

1. Check your ‘Geographic’ report for under performing countries

Different countries can perform wildly differently for the same keywords, ads and bid prices. This is particularly the case if you compare rich industrialised countries with developing countries.

  1. Choose a campaign and date range.
  2. Click on the AdWords Dimensions tab then select Geographic.
  3. Remove any geographic columns apart from Country/Region.

adwords geographic report

Are some countries performing considerably worse in terms of click-through rate, cost per click or cost per conversion? If so, depending on how differently the countries are performing:

  1. Stop targeting the under-performing countries; or
  2. Make a duplicate of that campaign for the under-performing counties, but bid less ( It is easy to duplicate a campaign in the free Google Adwords Editor); or
  3. Use a negative bid adjustment for the under-performing countries:

adwords geographic adjustments

2. Check your ‘Time>Day of the week’ report

Some products sell much better on certain days of the week. For example, B2B products probably sell better during the week than they do at the weekend. The opposite might be true for some B2C products. You can easily check this.

  1. Choose a campaign and date range.
  2. Click on the AdWords Dimensions tab then select Time>Day of the week.

adwords day of week reportAre some days of the week performing significantly better or worse than others? If so, you can schedule your bids to be more or less on different days of the week.

adwords bid adjustment schedule

3. Get rid of the dead wood

Keywords with low quality score and low click-through rates can drag your whole campaign down. You can easily set up filters to find the culprits.

adwords filteradwords filterAnd then pause or delete these keywords.adwords delete keywords

4. Add sitelink extensions

If your ad appears at the top of the page, you can optionally show sitelink extensions that hyperlink to particular pages. These increase the amount of screen real estate and text available to you and they don’t cost any extra. What’s not to like?

adwords-sitelink-extensionsTo add sitelink extensions:

  1. Select the appropriate campaign.
  2. Click on the Ad extensions tab and select Sitelinks extensions.
  3. Click the +EXTENSION button.

site link extensions

5. Check your ‘Search terms’ report for negative keywords

Unless you are only bidding on exact match, the queries that result in your ads being shown are not the same as the keywords you supply to Google. You need to use negative keywords to further control which search queries your ads appear for.

For example, if you are selling Windows backup software and bidding on backup software (as broad or phrase match) your ad may appear every time someone searches on mac backup software. This hurts you twice: wasted clicks (which costs you money directly) and reduced click-through rates (which reduces your quality scores and costs you money indirectly). You can avoid these issues, just by adding mac as a negative keyword.

To look for negative keywords:

  1. Choose a campaign and date range.
  2. Click on the AdWords Dimensions tab then select Search terms.

dimensions search terms report keywords

You will see a list of the searches that actually triggered your ads. Are there any searches there that shouldn’t be? If so, add the offending words as negative keywords, (either at campaign or ad group level).

Plug:  My Keyword Funnel AdWords tool can be very useful for sifting through large amounts of search queries to find negative keywords. Just paste in thousands of keywords from your search terms report and look at each keyword by frequency and context.

keyword funnel adwords tool

(This article was first published on www.keywordfunnel.com)

Exploit the long tail of Adwords PPC with Keyword Funnel

Adwords Keyword Funnel
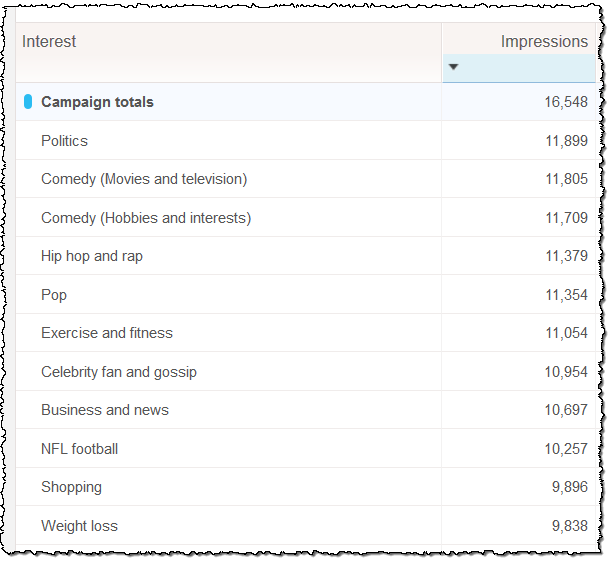
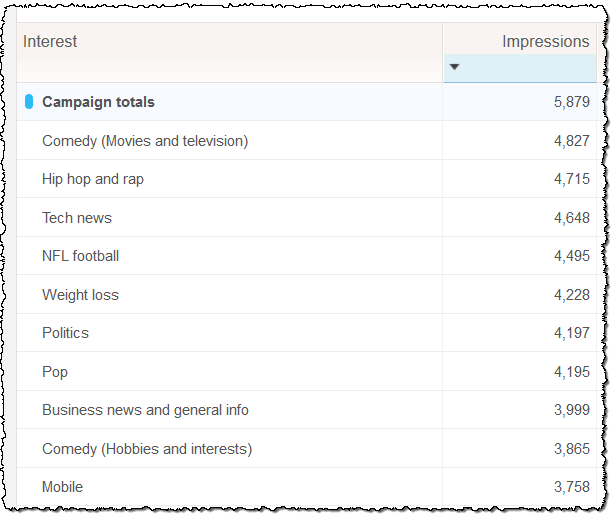
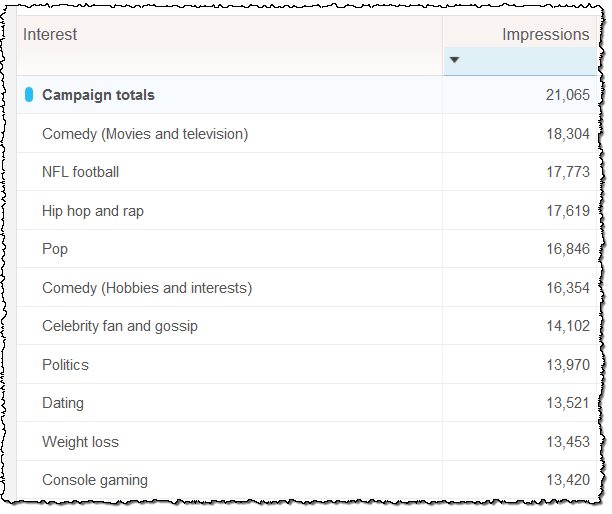
I released my new product Keyword Funnel today. It is a tool to help Adwords advertisers improve the profitability of their Adwords campaigns.

I have found the best way to get a decent volume of affordable conversions from Google Adwords is to use a ‘long tail’ strategy. For my Perfect Table Plan product there are a few ‘head’ keyword phrases that have high search volumes, such as “table plan” and “seating arrangement”. But these aren’t very well targeted (“table plan” might have been typed in by someone who wants drawing plans to make their own dining room table). Also lots of other people are bidding on these head phrases, pushing the bid prices up. This combination of poor targeting and high click prices makes it hard to make a profit on head keywords.

So I prefer to concentrate on ‘tail’ terms such as “table plan software mac” and “wedding seating arrangements program”. These are much better targeted, so convert a lot better. The clicks are also cheaper because less people are bidding on them. However the search volumes are much lower, so you need a lot of these tail terms to get a reasonable amount of traffic. At least hundreds, and preferably thousands. Hence ‘long tail’.

the long tail of Adwords PPCThe good news is that you can mine lots of different sources of data for these long tail keywords. For example you can extract keywords from your web logs, Google Analytics and Google Webmaster Tools accounts. Even though many searches are now listed with the keywords ‘not provided’ by Google, it still isn’t hard to come up with thousands of candidate keyword phrases. The bad news is that they aren’t in a usable form. Before you can import them into Adwords you need to:

  • Sort out duplicate phrases, foreign characters, capitalization and other noise.
  • Remove unwanted and negative keywords.
  • Group keyword phrases into tightly focussed adgroups.
  • Put the results in a form Adwords understands.

I tried to use Excel for this. But, marvellous tool though it is, it really wasn’t up to the job. So I wrote my own tool. This worked very well, but it wasn’t a commercial quality product. So I started again, from scratch 6 months ago. Keyword Funnel is the result.

Keyword Funnel allows you to add hundreds of keywords to new or existing Adwords campaigns in minutes, rather than hours. This makes long tail Adwords campaigns with hundreds or thousands of keywords a much more realistic proposition. It also allows you to set up new campaigns in a fraction of the time.

Keyword Funnel is available for Windows and Mac. It is priced at a one-time fee of just $49 (up to 2 Adwords accounts) or $99 (unlimited Adwords accounts). You can download a free trial from the website and it comes with a 60-day money back guarantee. The website is currently a little unpolished, but the software is well tested and robust. Any feedback is welcome.

Try Keyword Funnel now!