Category Archives: C++

CoverageValidator v3

The nice folk at Software Verification have done a major new release of Coverage Validator, and the new version fixes many of the issues I noted in a previous post. In particular:

  • The instrumentation can use breakpoint functionality to get better line coverage on builds with debug information enabled.
  • Previous sessions can be automatically merged into new sessions.
  • The default colour scheme has been toned down.
  • The flashing that happened when you resized the source window has gone.
  • It is now possible to mark sections of code not to be instrumented. I haven’t had time to try this yet, as it was only introduced in v3.0.4. But it should be very useful as currently I have a lot of defensive code that should never be reached (see below). Instrumenting this code skews the coverage stats and makes it harder to spot lines that should have been executed, but weren’t.

There are still a few issues:

  • I had problems trying to instrument release versions of my code.
  • It still fails to instrument some lines (but not many).
  • I had a couple of crashes during testing that don’t seem to have been caused by my software (although I can’t prove that).

But the technical support has been very responsive and new versions are released fairly frequently. Overall version 3 is a major improvement to a very useful tool. Certainly it helped me find a few bugs during the testing of version 4 of Perfect Table Plan on Windows. I just wish there was something comparable for MacOSX.

Using defence in depth to produce high quality software

‘Defence in depth’ is a military strategy where the attacker is allowed to penetrate the defender’s lines, but is then gradually worn down by successive layers of defences. This strategy was famously used by the Soviet Army to halt the German blitzkrieg at the battle of Kursk, using a vast defensive network including trenches, minefields and gun emplacements. Defence in depth also has parallels in non-military applications. I use a defence in depth approach to detect bugs in my code. A bug has to pass through multiple layers of defences undetected before it can cause problems for my customers.

Layer 1: Compiler warnings

Compiler warnings can help to spot many potential bugs. Crank your compiler warnings up to maximum sensitivity to get the most benefit.

Layer 2: Static analysis

Static analysis takes over where compiler warnings leave off, examining code in great detail looking for potential errors. An example static analyser is Gimpel PC-Lint for C and C++. PC-Lint performs hundreds of checks for known issues in C/C++ code. The flip side of it’s thoroughness is that it can be difficult to spot real issues amongst the vast numbers of warnings and it can take some time to fine-tune the checking to a useful level.

Layer 3: Code review

A fresh set of eyes looking at your code will often spot problems that you didn’t see. There are various ways to go about this, including formal Fagan inspections, Extreme Programming style pair programming and informal reviews. There is quite a lot of documented evidence to suggest that this is one of the most effective ways to find bugs. It is also an excellent way to mentor less experienced programmers. But it is time consuming and can be hard on the ego of the person being reviewed. Also it isn’t really an option for solo developers

Layer 4: Self-checking

Of the vast space of states that a program can occupy, usually only a minority will be valid. E.g. it might makes no sense to set a zero or negative radius for a circle. We can check for invalid states in C/C++ with an assert() macro:

class Circle
{
    public:
        void setRadius( double radius );
    private:
        double m_radius;
}

void Circle::setRadius( double radius )
{
    assert( radius > 0.0 );
    m_radius = radius;
}

The program will now halt with a warning message if the radius is set inappropriately. This can be very helpful for finding bugs during testing. Assertions can also be useful for setting pre-conditions and post-conditions:

    void List::remove( Item* i )
    {
        assert( contains( i ) );
        ...
        assert( !contains( i ) );
    }

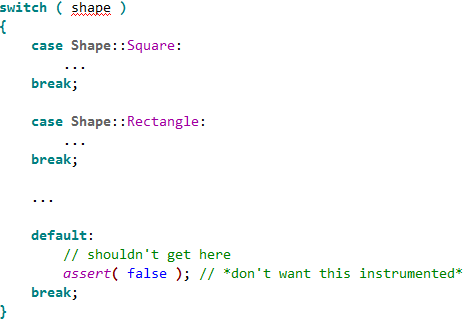
Or detecting when an unexpected branch is executed:

    switch ( shape )
    {
        case Shape::Square:
            ...
        break;

        case Shape::Rectangle:
            ...
        break;

        case Shape::Circle:
            ...
        break;

        case Shape::Ellipse:
            ...
        break;

        default:
            assert( false ); // shouldn't get here
        break;
    }

Assertions are not compiled into release versions of the software, which means they don’t incur any overhead in production code. But this also means:

  • Assertions are not a substitute for proper error handling. They should only be used to check for states that should never occur, regardless of the program input.
  • Calls to an assert() must not change the program state, or the debug and release versions will behave differently.

Different languages have different approaches, for example pre and post conditions are built into the Eiffel language.

Layer 5: Dynamic analysis

Dynamic checking usually involves automatically instrumenting the code in some way so that it’s runtime behaviour can be checked for potential problems such as: array bound violations, reading memory that hasn’t be written to and memory leaks. An example dynamic analyser is the excellent and free Valgrind for Linux. There are a few dynamic analysers for Windows, but they tend to be expensive. The only one I have tried in the last few years was Purify and it was flaky (do IBM/Rational actually use their own tools?).

Layer 6: Unit testing

Unit testing requires the creation of a test harness to execute various tests on a small unit of code (typically a class or function) and flag any errors. Ideally the unit tests should then be executed every time you make a change to the code. You can write your own test harnesses from scratch, but it probably makes more sense to use one of the existing frameworks, such as: NUnit (.NET), JUnit (Java), QUnit (Qt) etc.

According to the Test Driven Development approach you should write your unit tests before you write the code. This makes a lot of sense, but requires discipline.

Layer 7: Integration testing

Integration testing involves testing that different modules of the system work correctly together, particularly the interfaces between your code and hardware or third party libraries.

Layer 8: System testing

System testing is testing the system in it’s entirety, as delivered to the end-user. System testing can be done manually or automatically, using a test scripting tool.

Unit, integration and system testing should ideally be done using a coverage tool such as Coverage Validator to check that the testing is sufficiently thorough.

Layer 9: Regression testing

Regression testing involves running a series of tests and comparing the results to the same input data run on the previous release of the system. Any differences may be the result of bugs introduced since the last release. Regression testing works particularly well on systems that take a single input file and produce a single output file – the output file can just be diff’ed against the previous output.

Layer 10: Third party testing

Different users have different patterns of usage. You might prefer drag and drop, someone else might use right-click a lot and yet another person might prefer keyboard accelerators. So it would be unwise to release a system that has only ever been tested by the developer. Furthermore, the developer inevitably makes all sorts of assumptions about how the software will be used. Some of those assumptions will almost certainly be wrong.

There are a number of companies that can be paid by the day to do third party testing. I have used softwareexaminer.com in the past with some success.

Layer 11: Beta testing

End-user systems can vary in processor speed, memory, screen resolution, video card, font size, language choice, operating system version/update level and installed software. So it is necessary to test your software on a representative range of supported hardware + operating system + installed software. Typically this is done by recruiting users who are keen to try out new features, for example through a newsletter. Unfortunately it isn’t always easy to get good feedback from beta testers.

Layer 12: Crash reporting

If each of the above 11 layers of defence catches 50% of the bugs missed by the previous layer, we would expect only 1 bug in 2,048 to make it into production code undetected. Assuming your coding isn’t spectacularly sloppy in the first place, you should end up with very few bugs in your production code. But, inevitably, some will still slip through. You can catch the ones that crash your software with built-in crash reporting. This is less than ideal for the person whose software crashed. But it allows you to get detailed feedback on crashes and consequently get fixes out much faster.

I rolled my own crash reporting for Windows and MacOSX. On Windows the magic function call is SetUnhandledExceptionFilter. You can also sign up to the Windows Winqual program to receive crash reports via Windows’ own crash reporting. But, after my deeply demoralising encounter with Winqual as part of getting the “works with Vista” logo, I would rather take dance lessons from Steve Ballmer.

Test what you ship, ship what you test

A change of a single byte in your binaries could be the difference between a solid release and a release with a showstopper bug. Consequently you should only ship the binaries you have tested. Don’t ship the release version after only having tested the debug version and don’t ship your software after a bug fix without re-doing the QA, no matter how ‘trivial’ the fix. Sometimes it is better to ship with minor (but known) bugs than to try to fix these bugs and risk introducing new (and potentially much worse) bugs.

Cross-platform development

I find that shipping my software on Windows and MacOSX from a single code base has advantages for QA.

  • different tools with different strengths are available on each platform
  • the Gnu C++ compiler may warn about issues that the Visual Studio C++ compiler doesn’t (and vice versa)
  • a memory error that is intermittent and hard to track down on Windows might be much easier to find on MacOSX (and vice versa)

Conclusion

For the best results you need your layers of checks to be part of your day-to-day development, not something you do just before a release. This is best done by automating them as much as possible, e.g.:

  • setting the compiler to treat warnings as errors
  • performing static analysis and unit tests on code check-in
  • running regression tests on the latest version of the code every night

Also you should design your software in such a way that it is easy to test. E.g. building in log file output can make it much easier to perform regression tests.

Defence in depth can find a high percentage of bugs. But obviously the more bugs you start with the more bugs that will end up in your code. So it doesn’t remove the need for good coding practices. Quality can’t be ‘tested in’ to code afterwards.

I have used all 12 layers of defence above at some point in my career. Currently I am not using static analysis (I must update that PC-Lint licence), code review (I am a solo developer) and dynamic analysis (I don’t currently have a dynamic analyser for Windows or MacOSX). I could also do better on unit testing. But according to my crash reporting, the latest version of PerfectTablePlan has crashed just three times in the last 5000+ downloads (the same bug each time, somewhere deep down in the Qt print engine). Not all customer click the ‘Submit’ button to send the crash reports and crashes aren’t the only type of bug, but I think this is indicative of a good level of quality. It is probably a lot better than most of the other consumer software my customers use[1]. Assuming the crash reporting isn’t buggy, of course…

[1]Windows Explorer and Microsoft Office crash on a daily basis on my current machine.

ACCU 2008

accu.pngI will be tearing myself away from my computer to attend the ACCU conference in Oxford on Thursday 3rd and Friday 4th April (including the dinner on the Friday). There is an interesting schedule of talks. I am hoping to find out a bit about the new C++ 200x standard, functional languages and other new developments. But, as always with such events, the most useful information often comes from chatting to other attendees between sessions. If you are at the conference, do come and say hello (mug shot here).

Choosing a development ‘stack’ for Windows desktop applications

beauty_parade.jpgI have have heard plenty of people saying that desktop software is dead and that all future development will be done for the web. From my perspective, as both a buyer and seller of software, I think they are wrong. In fact, of the thousands of pounds I have spent on software in the last three years, I would guess that well over 90% of it was spent on software that runs outside the browser. The capabilities of web based applications have improved a lot in recent years, but they still have a long way to go to match a custom built native application once you move beyond CRUD applications. I don’t expect to be running Visual Studio, PhotoShop or VMWare (amongst others) inside the browser any time soon. The only way I see web apps approaching the flexibility and performance of desktop apps is for the browser to become as complicated as an OS, negating the key reason for having a browser in the first place. To me it seems more likely that desktop apps will embed a browser and use more and more web protocols, resulting in hybrid native+web apps that offer the best of both worlds.

So, if Windows desktop apps aren’t going away any time soon, what language/libraries/tools should we use to develop them? It is clear that Microsoft would like us to use a .Net development environment, such as C#. But I question the wisdom of anyone selling downloadable off-the-shelf software based on .Net [1]. The penetration of .Net is less than impressive, especially for the more recent versions. From stats published by SteG on a recent BOS post (only IE users counted):

No .Net: 28.12%
>= .Net 1.0: 71.88%
>= .Net 1.1: 69.29%
>= .Net 2.0: 46.07%
>= .Net 3.0: 18.66%
>= .Net 3.5: 0.99%

Consequently deploying your app may require a framework update. The new .Net 3.5 framework comes with a 2.7 MB installer, but this is only a stub that downloads the frameworks required. The full set of frameworks weighs in at eye watering 197 MB. To find out how much the stub really downloads Giorgio installed .Net 3.5 onto a Windows 2003 VM with only .Net 1.0 & 1.1. The result: 67 MB. That is still a large download for most people, especially if your .Net 3.5 software is only a small utility. It is out of the question if you don’t have broadband. Microsoft no doubt justify this by saying that the majority of PCs will have .Net 3.5 pre-installed by the year X. Unfortunately by the year X Microsoft will probably be pushing .Net 5.5 and I dread to think how big that will be.

I have heard a lot of people touting the productivity benefits of C# and .Net, but the huge framework downloads can only be a major hurdle for customers, especially for B2C apps. You also have issues protecting your byte code from prying eyes, and you can pretty much forget cross-platform development. So I think I will stick to writing native apps in C++ for Windows for the foreseeable future.

There is no clear leader amongst the development ‘stacks’ (languages+libraries+tools) for native Win32 development at present. Those that spring to mind include:

  • Delphi – Lots of devoted fans, but will CodeGear even be here tomorrow?
  • VB6 – Abandoned and unloved by Microsoft.
  • Java – You have to have a Java Run Time installed, and questions still remain about the native look and feel of Java GUIs.
  • C++/MFC – Ugly ugly ugly. There is also the worry that it will be ‘deprecated’ by Microsoft.
  • C++/Qt – My personal favourite, but expensive and C++ is hardly an easy-to-use language. The future of Qt is also less certain after the Nokia acquisition.

Plus some others I know even less about, including: RealBasic and C++/WxWidgets. They all have their down sides. It is a tough choice. Perhaps that is why some Windows developers are defecting to Mac, where there is really only one game in town (Objective-C/Cocoa).

I don’t even claim that the opinions I express here are accurate or up-to-date. How could they be? If I kept up-to-date on all the leading Win32 development stacks I wouldn’t have any time left to write software. Of the stacks listed I have only used C++/MFC and C++/Qt in anger and my MFC experience (shudder) was quite a few years ago.

Given that one person can’t realistically hope to evaluate all the alternatives in any depth, we have to rely on our particular requirements (do we need to support cross platform?), hearsay, prejudice and which language we are most familiar with to narrow it down to a realistic number to evaluate. Two perhaps. And once we have chosen a stack and become familiar with it we are going to be loathe to start anew with another stack. Certainly it would take a lot for me to move away from C++/Qt, in which I have a huge amount of time invested, to a completely new stack.

Which Windows development stack are you using? Why? Have I maligned it unfairly above?

[1] Bespoke software is a different story. If you have limited deployment of the software and can dictate the end-user environment then the big download is much less of an issue.

Coverage Validator

coverage_validator.pngThe sink is full of washing, I am wearing odd socks and I haven’t been out of the house in days. It must be time to put out that new release. But how can I be sure my testing hasn’t missed a hideously embarrassing bug? Maybe I introduced a major bug when I made that ‘cosmetic’ change at 2am?

In an ideal world I would just run a comprehensive automated regression test suite. Unfortunately it is difficult to automate graphical user interface (GUI) testing and the majority of lines of code in most applications are GUI. I estimate that the code for my own table planner software is at least 75% GUI code (not including generated code, which would push it even higher).

So I try to manually execute every line of my application before I release it. If I have to make any changes to the code, I start over again. This is very dull, but at least I have a tool to help me: Coverage Validator. Coverage Validator instruments code and shows, in real time, which lines have been executed. Click a few buttons on your application and watch the executed lines of code change colour from pink to yellow. Execute every line in the file and all the lines change colour to cyan. No recompilation or relinking is required and it doesn’t slow down the tested application too much. This real-time feedback is incredibly powerful for testing.

code_coverage_small.gif

Unfortunately it also has a lot of shortcomings:

  • The usability isn’t great. There is a confusing plethora of options for instrumenting your code that I would rather not have to know about.
  • It isn’t able to ‘hook’ (instrument) all the lines of code. Whole blocks get missed out for reasons I don’t fully understand. Single line branches are particularly likely to be missed.
  • The GUI isn’t great. For example, the display flashes horribly if you resize it.
  • The automatic results merging is just plain weird. At the end of a session it can merge your coverage results into a previous session. This information isn’t much use to me at the end of a session. I want to merge previous results at the start of a session so I know which lines I haven’t tested.
  • The GUI is quite ugly. They really need to update those tired old icons.

However being able to see line coverage information in real time is just so incredibly useful that I am prepared to put up with the many shortcomings. I just run my application alongside Coverage Validator and, file-by-file and function-by-function, I try to turn the lines of code yellow (or, better still, cyan). Every time I have used Coverage Validator I have found at least one potentially embarrassing bug that I hadn’t discovered by any other means. The support has also been responsive. It is just a pity about the flaws, without them this would be a ‘killer app’ for testing.

Coverage Validator works with C++, Delphi and VB on Windows NT4, 2000, 2003 and XP[1]. A single licence costs $199. A free 30-day evaluation licence is available.

[1]I am using it on Vista currently, and it seems to work fine.

Nokia to acquire Trolltech (makers of Qt)

trolltechTelecoms giant Nokia are to acquire Trolltech, the company behind leading cross-platform toolkit Qt. As a fan and long time user of Qt this makes me a little nervous. I hope it will lead to more investment in Qt and lower maintenance fees. The opposite could happen of course. It isn’t unknown for a large company to buy a good product and then ruin it (the purchase of Purify by Rational springs to mind). At least I have the full source code for Qt if it all goes to hell in a handbasket. I learnt long ago (the hard way) that you should never depend on a third party libraries if you don’t have the source.

Optimising your application

When I first released PerfectTablePlan I considered 50-200 guests as a typical event size, with 500+ guests a large event. But my customers have been using the software for ever larger events, with some as large as 3000 guests. While the software could cope with this number of guests, it wasn’t very responsive. In particular the genetic algorithm I use to optimise seating arrangements (which seats people together or apart, depending on their preferences) required running for at least an hour for the largest plans. This is hardly surprising when you consider that seating assignment is a combinatorial problem in the same NP-hard class as the notorious travelling salesman problem. The number of seating combinations for 1000 guests in 1000 seats is 1000!, which is a number with 2,658 digits. Even the number of seating combinations for just 60 guests is more than the number of atoms in the known universe. But customers really don’t care about how mathematically intractable a problem is. They just want it solved. Now. Or at least by the time they get back from their coffee. So I made a serious effort to optimise the performance in the latest release, particularly for the automatic seat assignment. Here are the results:

ptp308_vs_ptp_310.png

Total time taken to automatically assign seats in 128 sample table plans varying in size from 0 to 1500 guests

The chart shows that the new version automatically assigns seats more than 5 times faster over a wide range of table plans. The median improvement in speed is 66%, but the largest plans were solved over ten times faster. How did I do it? Mostly by straightening out a few kinks.

Some years ago I purchased my first dishwasher. I was really excited about being freed from the unspeakable tyranny of having to wash dishes by hand (bear with me). I installed it myself – how hard could it be? It took 10 hours to do a wash cycle. Convinced that the dishwasher was faulty I called the manufacturer. They sent out an engineer who quickly spotted that I had kinked the water inlet pipe as I had pushed the dishwasher into place. It was taking at least 9 hours to get enough water to start the cycle. Oops. As soon as the kink was straightened it worked perfectly, completing a cycle in less than an hour. Speeding up software is rather similar – you just need to straighten out the kinks. The trick is knowing where the kinks are. Experience has taught me that it is pretty much impossible to guess where the performance bottlenecks are in any non-trivial piece of software. You have to measure it using a profiler.

Unfortunately Visual Studio 2005 Standard doesn’t seem to include profiling tools. You have to pay for one of the more expensive versions of Visual Studio to get a profiler. This seems rather mean. But then again I was given a copy of VS2005 Standard for free by some nice Microsofties – after I had spent 10 minutes berating them on the awfulness of their “works with vista” program (shudder). So I used an evaluation version of LTProf. LTProf samples your running application a number of times per second, works out which line and function is being executed and uses this to build up a picture of where the program is spending most time.

After a bit of digging through the results I was able to identify a few kinks. Embarrassingly one of them was that the automatic seat assignment was reading a value from the Windows registry in a tight inner loop. Reading from the registry is very slow compared to reading from memory. Because the registry access was buried a few levels deep in function calls it wasn’t obvious that this was occurring. It was trivial to fix once identified. Another problem was that some intermediate values were being continually recalculated, even though none of the input values had changed. Again this was fairly trivial to fix. I also found that one part of the seat assignment genetic algorithm took time proportional to the square of the number of guests ( O(n^2) ). After quite a bit of work I was able to reduce this to a time linearly proportional to the number of guests (O(n) ). This led to big speed improvements for larger table plans. I didn’t attempt any further optimisation as I felt was getting into diminishing returns. I also straightened out some kinks in reading and writing files, redrawing seating charts and exporting data. The end result is that the new version of PerfectTablePlan is now much more usable for plans with 1000+ guests.

I was favourably impressed with LTProf and will probably buy a copy next time I need to do some optimisation. At $49.95 it is very cheap compared to many other profilers (Intel VTune is $699). LTProf was relatively simple to use and interpret, but it did have quirks. In particular, it showed some impossible call trees (showing X called by Y, where this wasn’t possible). This may have been an artefect of the sampling approach taken. I will probably also have a look at the free MacOSX Shark profiler at some point.

I also tried tweaking compiler settings to see how much difference this made. Results are shown below. You can see that there is a marked difference with and without compiler optimisation, and a noticeable difference between the -O1 and -O2 optimisations (the smaller the bar, the better, obviously):

vs2005_optimisation_speed.png

Effect of VS2005 compiler optimisation on automatic seating assignment run time

Obviously the results might be quite different for your own application, depending on the types of calculations you are doing. My genetic algorithm is requires large amounts of integer arithmetic and list traversal and manipulation.

The difference in executable sizes due to optimisation is small:

vs2005_optimisation_size.png

I tried the two other optimisation flags in addition to -O2.

  • /OPT:NOWIN98 – section alignment does not have to be optimal for Windows 98.
  • /GL – turns on global optimisation (e.g. across source files, instead of just within source files).

Neither made much noticeable difference:

vs2005_additional_opt.png

However it should be noted that most of the genetic algorithm is compiled in a single file already, so perhaps /GL couldn’t be expected to add much. I compared VC++6 and VS2005 version of the same program and found that VS2005 was significantly faster[1]:

vc6_vs_vs2005_optimisation_speed1.png

I also compared GCC compiler optimisation for the MacOSX version. Compared with VS2005 GCC has a more noticeable difference between optimised and unoptimised, but a smaller difference between the different optimisations:

gcc_optimisation_speed.png

Surprisingly -O3 was slower than -O2. Again the effect of optimisation on executable size is small.

gcc_optimisation_size2.png

I also tested the relative speeds of my 3 main development machines[2]:

relative-machine-speed.png

It is interesting to note that the XP box runs the seat assignment at near 100% CPU utilisation, but the Vista box never goes above 50% CPU utilisation. This is because the Vista box is a dual core, but my the seat assignment is currently only single threaded. I will probably add multi-threading in a future version to improve the CPU utilisation on multi-core machines.

In conclusion:

  • Don’t assume, measure. Use a profiler to find out where your application is spending all its time. It almost certainly won’t be where you expected.
  • Get the algorithm right. This can make orders of magnitude difference to the runtime.
  • Compiler optimisation is worth doing, perhaps giving a 2-4 times speed improvement over an application built without compiler optimisation. It probably isn’t worth spending too much time tweaking compiler settings though.
  • Don’t let a software engineer fit your dishwasher.

Further reading:

“Programming pearls” by Jon Bentley a classic book on programming and algorithms

“Everything is fast for small n” by Jeff Atwood on the Coding Horror blog

[1] Not strictly like-for-like as the VC++6 version used dynamic Qt libraries, while the VS2005 version used static Qt libraries.

[2] I am assuming that VS2005 and GCC produce comparably fast executables when both set to -O2.

Codekana

codekanaI don’t remember when or where I first saw an editor with syntax highlighting. But I do remember that I was ‘blown away’ by it. It was immediately obvious that it was going to make code easier to understand and syntax errors easier to spot. I would now hate to have to program without it. So I was interested to try version 1.1of CodeKana, a recently released C/C++/C# syntax highlighting add-in for Visual Studio.

Codekana features include:

  • Finer grained syntax highlighting than VS2005 provides.
  • Highlighting of non-matching brackets and braces as you type.
  • Easy switching between header and body files.

In the code below Codekana colours the if/else/while blocks differently and visually pairs the braces:

syntax highlighting

I have only been using Codekana a few hours, but I am already impressed. I find the ability to quickly switch between C++ header and body files particularly useful. VS2005 only appears to allows switching body to header, not header to body (doh!). You need the dexterity of a concert pianist for the default Codekana keyboard shortcut (Ctrl-Shift-Alt-O), but it can be customised. I changed it to Ctrl+. (dot) .

Codekana also has other features, such as the ability to zoom in/out on code. This is quite ‘cool’, but I’m not sure yet whether it will be of much use. Time will tell.

I am new to VS2005 and I have yet to try out other add-ins, such as Visual Assist, but Codekana certainly seems to have a lot of potential and is excellent value at $39. I look forward to seeing what other features get added in future versions. Find out more and download the free trial here.

Disclosure: The author of Codekana is a JoS regular who I have corresponded with in the past and was kind enough to send me a complimentary licence.