Tag Archives: visualisation

Transform Messy Data into Insights with Easy Data Transform Advanced Edition

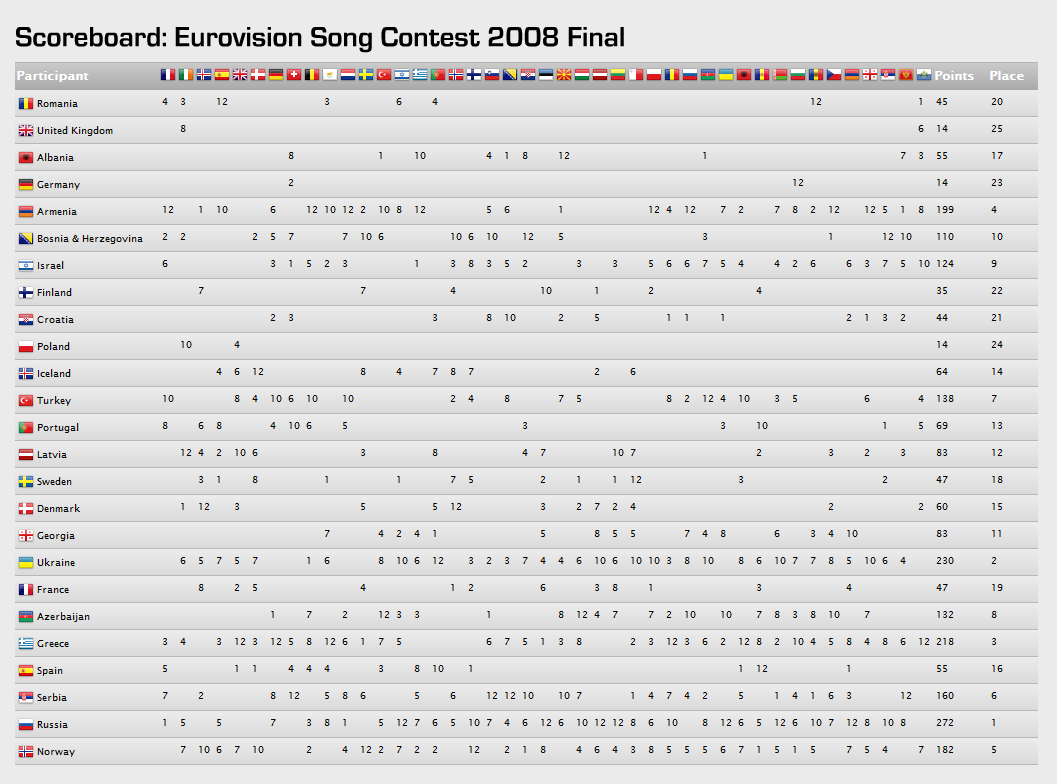
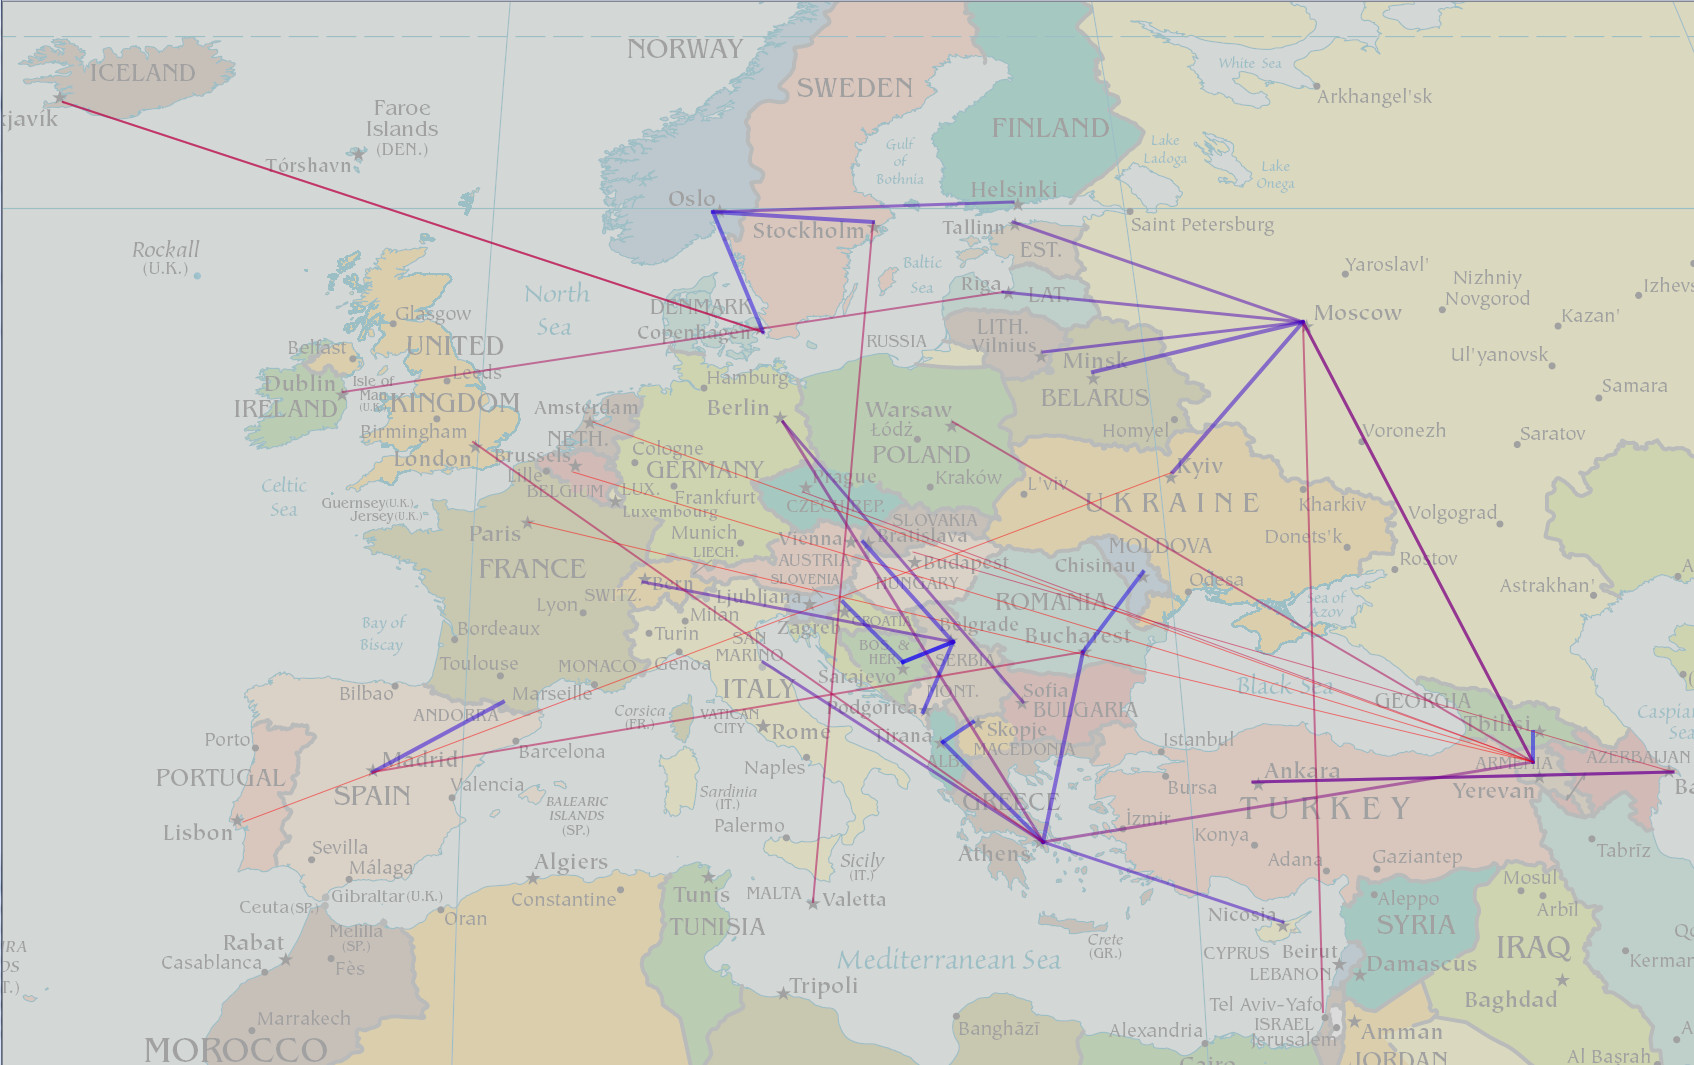
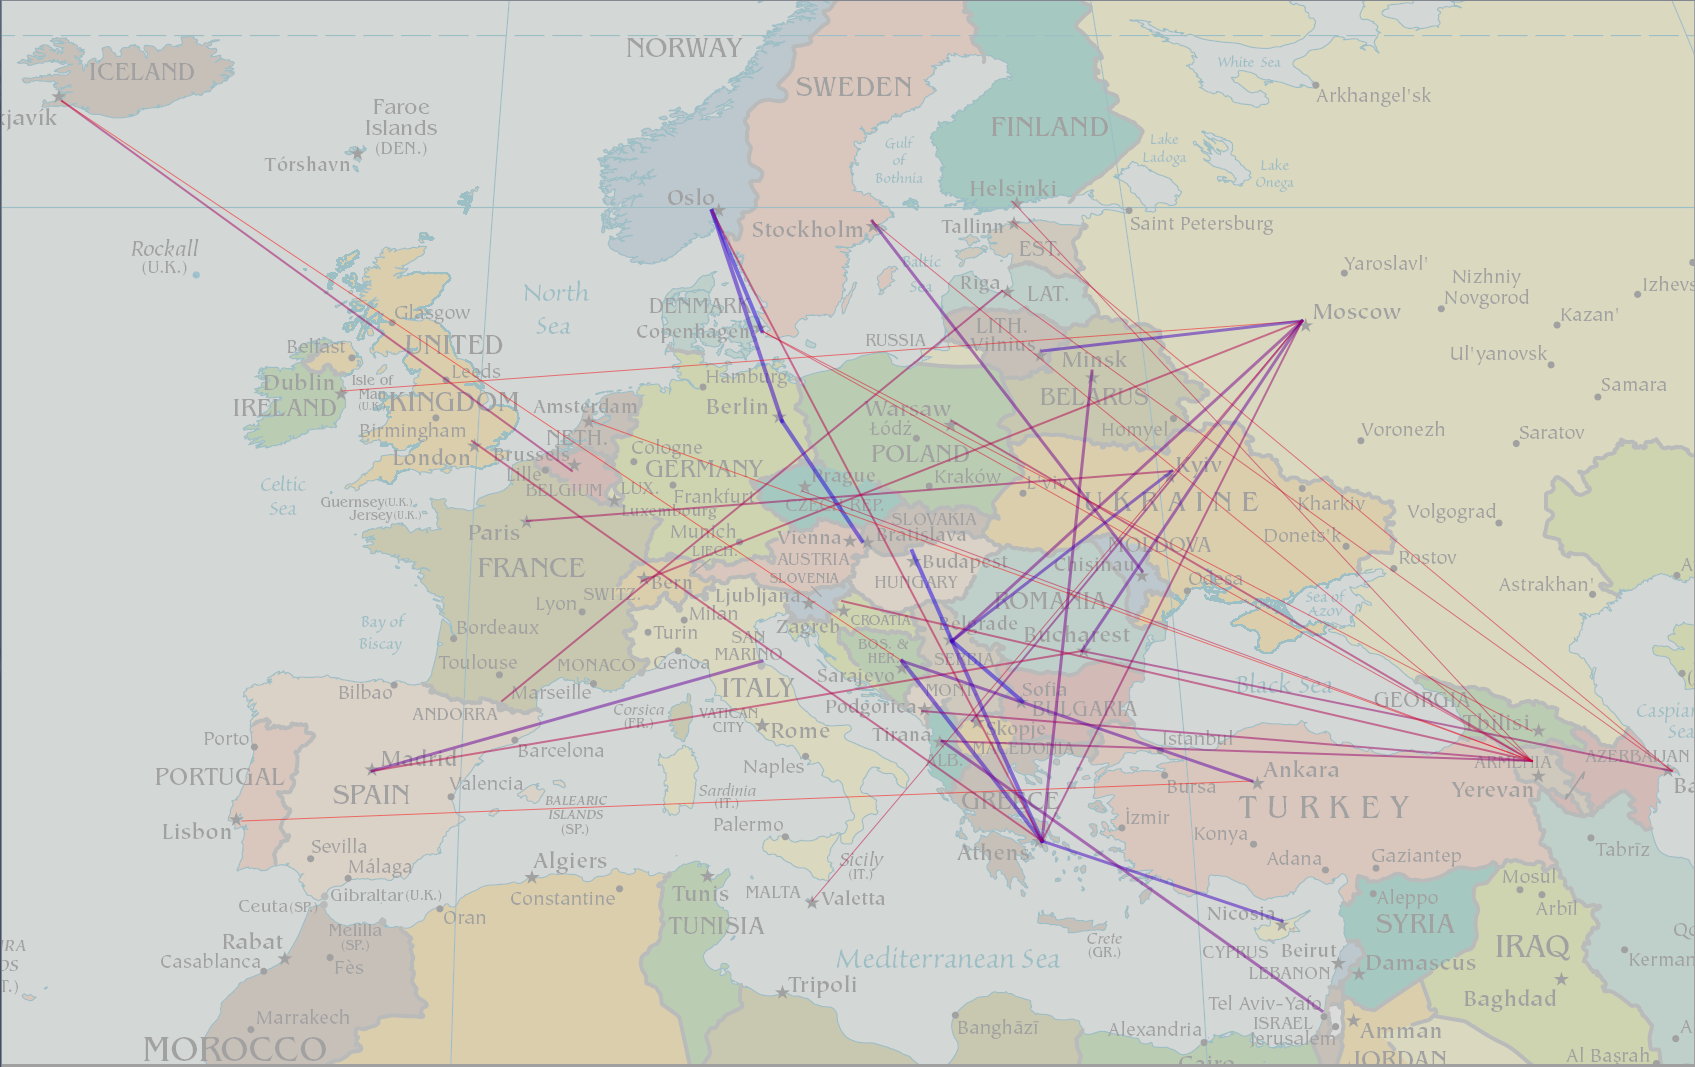
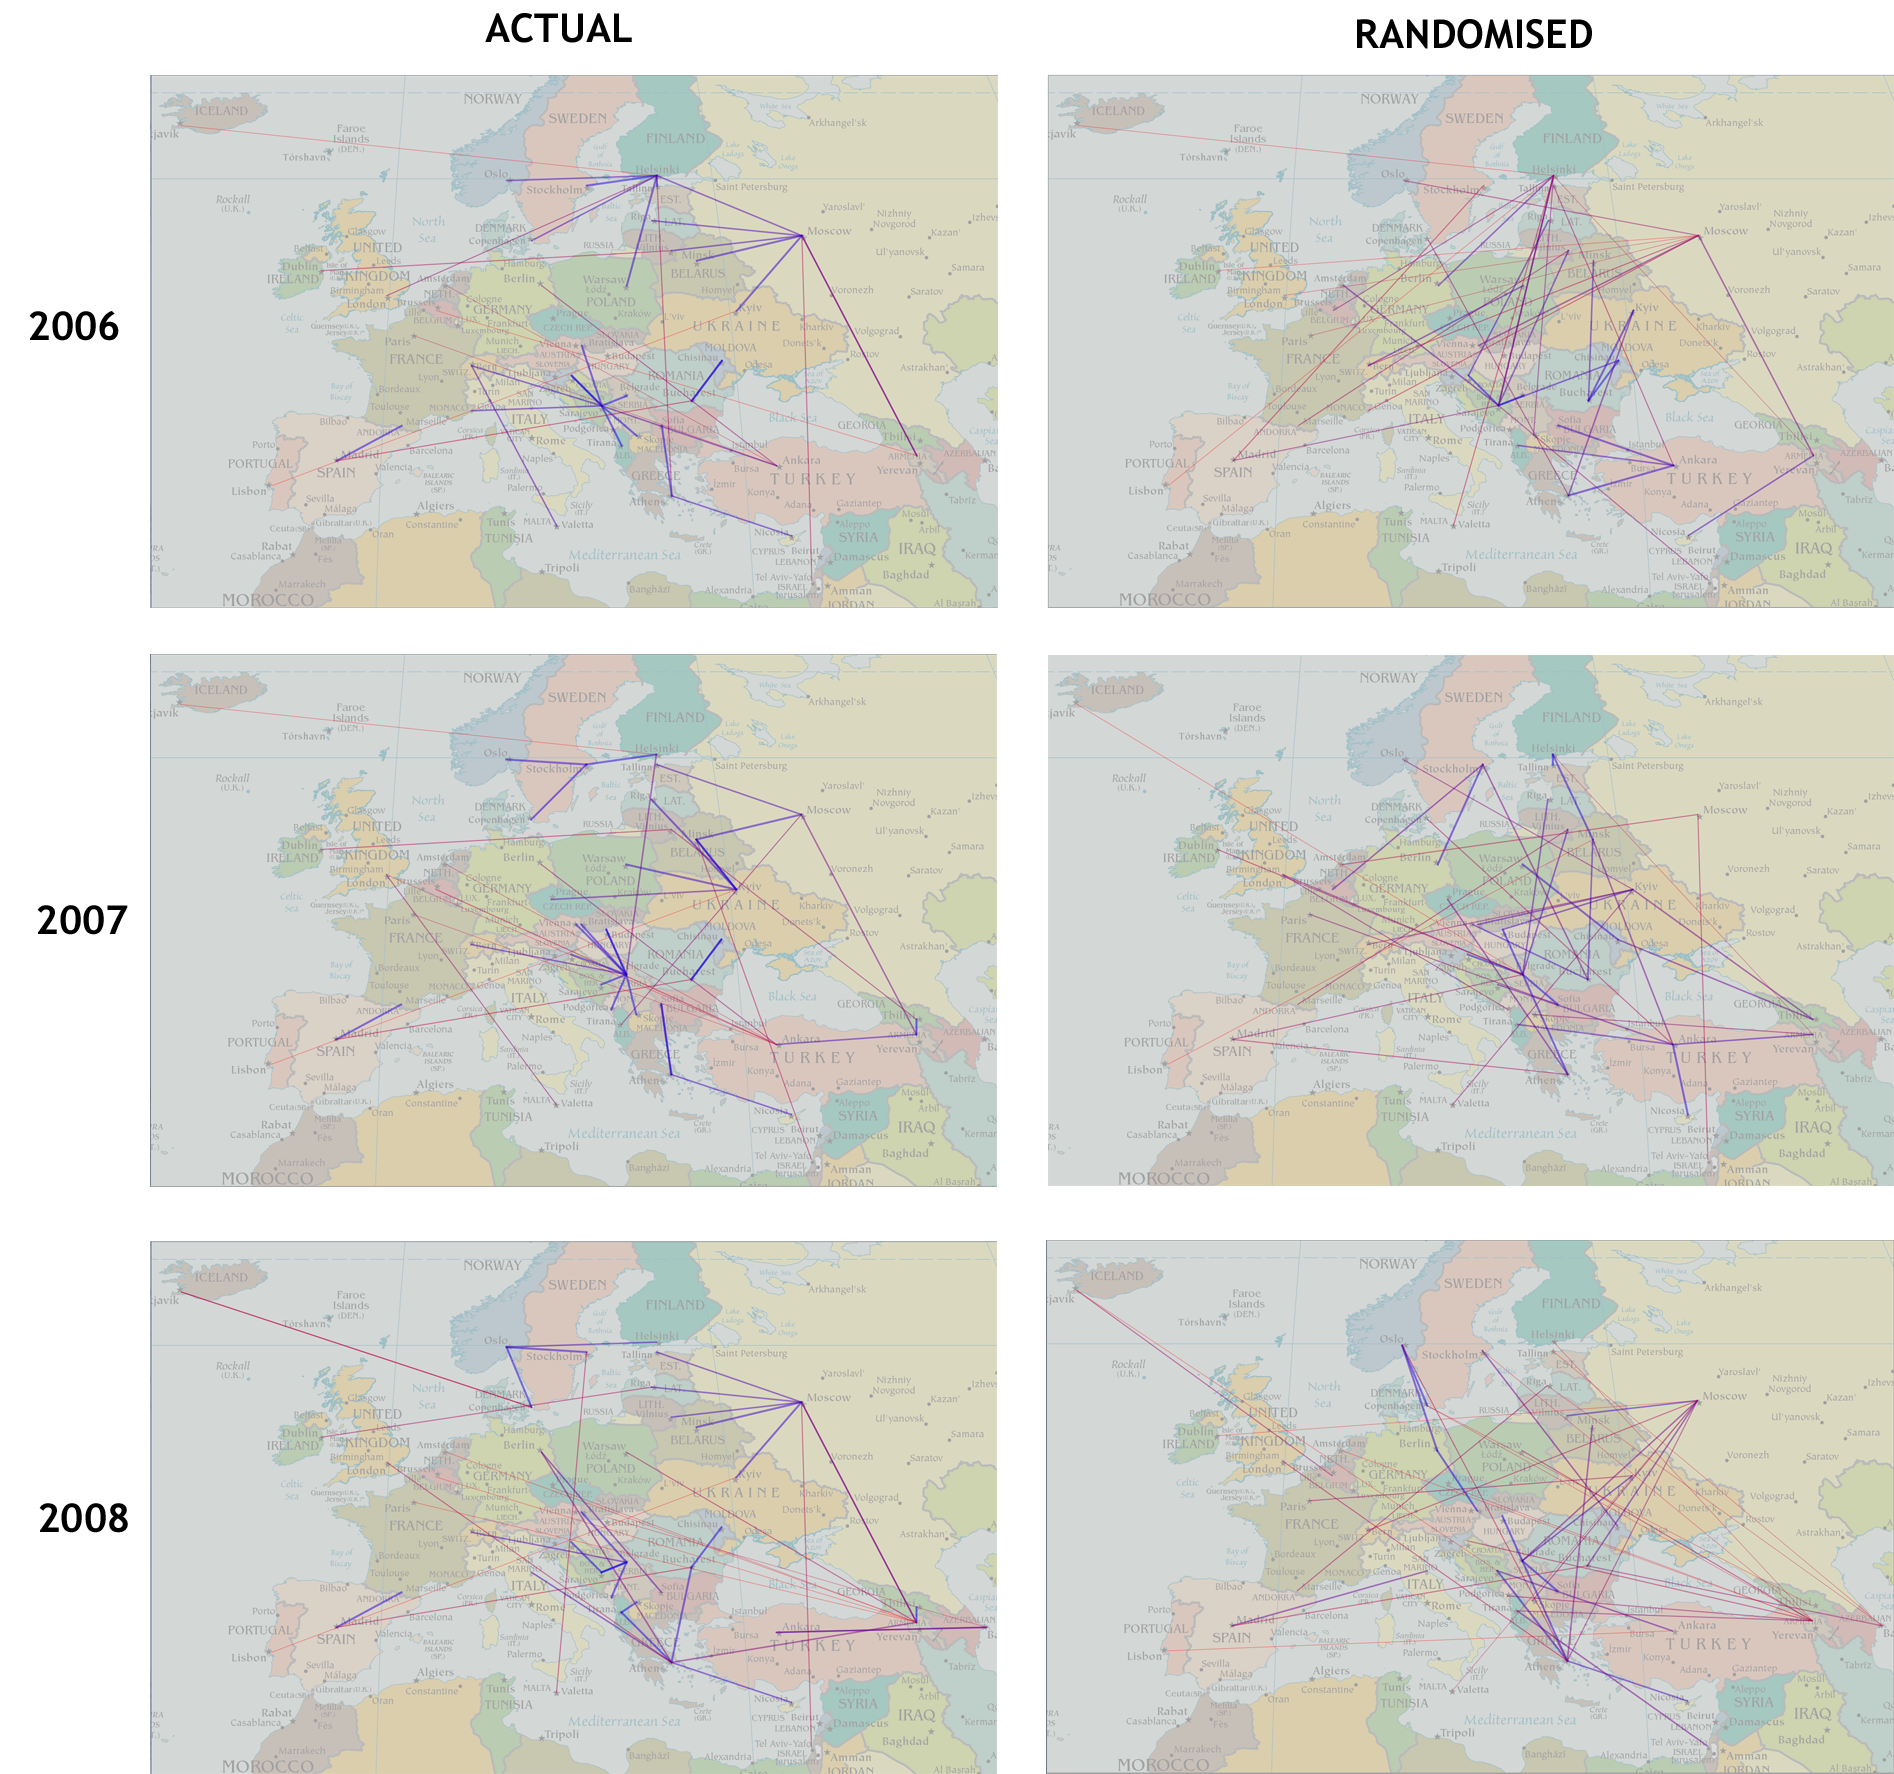
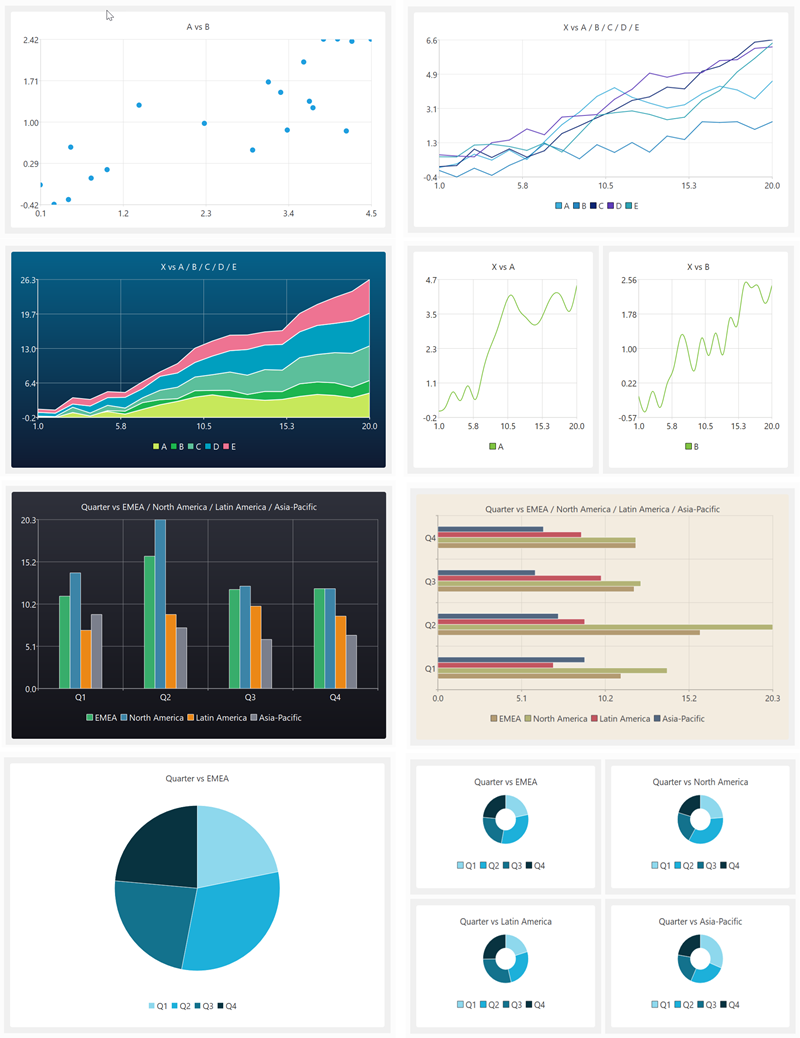
My data wrangling product, Easy Data Transform, got a major upgrade yesterday, with the addition of data visualization capabilities. Here are some examples of what it can produce in a few clicks:

You can see this new visualization feature in action in the video below:

(Likes and subscribes help me with the YouTube algorithm and are much appreciated)

Human brains are highly developed for visual processing. But data is often messy and in the wrong form for visualization. So data wrangling and visualization, tightly integrated together, is a powerful combination. It was a lot of work, but it makes Easy Data Transform a much more complete, end-to-end, solution. No more pasting data into Excel to get a chart!

At the same time, I have segmented Easy Data Transform into 2 products: Easy Data Transform Core Edition (data wrangling, one-time fee $99) and Easy Data Transform Advanced Edition (data wrangling+visualization, one-time fee $198). The Advanced Edition is a paid upgrade from the original product. Optional, of course. I sweetened the deal with a time-limited discount for existing customers who want to upgrade to Advanced Edition. The response from Easy Data Transform customers has been very positive.

Have you got some messy data, you want to turn into insights? Why not give Easy Data Transform Advanced Edition a try? It:

  • Runs natively on Windows and Mac.
  • Is drag and drop (no syntax to remember).
  • Does not store your precious data on someone else’s server.
  • Is deterministic and will not hallucinate!
  • Can process millions of rows in seconds.
  • Can create re-usable templates for repeatable processes.

You can download a free trial here. And you can get 15% off Easy Data Transform Advanced Edition until 17-Jul-2026 using this discount link.

Visualization

This video shows all commercial air traffic in the world during a 24-hour period. Although the technique used is very simple in principal, it conveys a huge amount of information in a short space of time.

From gdyel2007 at dailymotion via TechTalk Newsletter.

I use various simple visualisation techniques in my table planning software, for example males can be shown in blue and females in pink. This allows the host to check at a glance whether they have a good distribution of genders.

visualization

Could you use colour, shape, size, positioning, motion or other visual cues to better convey information to your users?

Is the Eurovision song contest rigged?

There has been a lot of moaning in the UK press that the Eurovision song contest is rigged. Specifically that countries are voting for each other in geographical blocs, with little regard for the merit of the songs. But are they? It is hard to see any patterns from looking at a table of voting results:

Eurovision 2008 voting

2008 results from Eurovision.tv, click to enlarge.

So I created a simple visualisation of the data[1], similar to one of the approaches I use in my table planner software, PerfectTablePlan. In this visualisation I draw a line from each country to the country that it gave the highest points to. The closer the country is geographically, the thicker and bluer the line.

Eurovision 2008 voting visualisation

Eurovision 2008 voting patterns. Click to enlarge.

Looking at the diagram, there does appear to be bloc voting going on in the Balkans, Scandinavia & the former Soviet Union. But what would the voting look like if there was no bloc voting? To find out I randomly swapped columns in the table. For example votes made by the UK I assigned to Belarus and votes made by San Marino[2] I assigned to the UK. So each finalist now has the same number of incoming votes, but from random countries. Assuming they are voting for the best (or least awful) song, not by geography, the results should look similar. The randomised version looks more, well, random.

randomised Eurovision 2008 voting patterns

Randomised Eurovision 2008 voting patterns. Click to enlarge.

These results are suggestive, but not conclusive. But If I put the last 3 year’s results together with their randomised versions, I think there is little doubt that geography is the key factor in determining Eurovision voting patterns. The actual voting patterns look remarkably similar year-on-year and the difference between the actual and randomised results are quite marked.

Eurovision voting patterns

Eurovision voting patterns, actual and randomised, for 2006, 2007 and 2008. Click to enlarge.

Maybe if the western European countries liked each other a bit more, the UK wouldn’t have come last this year? But I can’t really see Britain, Spain, France and Germany voting for each other any time soon. ;0)

Does it really matter whether Eurovision song contest voting is based on merit? It certainly won’t keep me awake at night. But I think it is a nice illustration of how you can use simple visualisation techniques (even something hacked together in a few hours) to turn raw data into usable information. The human brain has incredibly powerful visual processing hardware. Have you optimised your software to run on this platform?

[1] I wrote some throwaway code to generate these images in C++ and Qt over a few hours on a wet bank holiday Sunday. QA amounted to ‘that looks about right’.

[2] I’ve never heard of it either – but apparently it gets as many votes as the UK.