I wanted to be able to read and write Excel file on Windows and Mac from my C++/Qt application, whether Excel is installed or not. I would rather commit suicide with a cheese grater, than try to write my own code to parse whatever horrific format Excel is written in. So I looked around for a library.
I ended up buying a licence for LibXL, from XLWare, back in 2019. It has been working great ever since. I now also use it in PerfectTablePlan v7.
Things to like:
Available as a library for Windows, Mac, Linux and iOS (I have only used it for Windows and Mac, so far).
Accessible from lots of languages, including: C, C++, .Net, Delphi, PHP, Python, PowerBASIC and Fortran.
Example code is available in C++, C, C# and Delphi.
Good support.
Regular updates.
Reasonable pricing.
No per-user fees.
The API is a little low-level for my taste, but I guess that is inevitable when you support C as well as C++. Reading and writing is slow compared to reading and writing the same data to/from a CSV file. But, no doubt, that is due to the limitations of the Excel file format.
I don’t have any affiliation with LibXL beyond being a paying customer, and I haven’t been asked to write this. I just wanted to give a shout-out to the developer, Dmytro, for his sterling work. Long may it continue.
This sounds like a question a programmer might ask after one medicinal cigarette too many. The computer science equivalent of “what is the sounds of one hand clapping?”. But it is a question I have to decide the answer to.
I am adding indexOf() and lastIndexOf() operations to the Calculate transform of my data wrangling (ETL) software (Easy Data Transform). This will allow users to find the offset of one string inside another, counting from the start or the end of the string. Easy Data Transform is written in C++ and uses the Qt QString class for strings. There are indexOf() and lastIndexOf() methods for QString, so I thought this would be an easy job to wrap that functionality. Maybe 15 minutes to program it, write a test case and document it.
Obviously it wasn’t that easy, otherwise I couldn’t be writing this blog post.
First of all, what is the index of “a” in “abc”? 0, obviously. QString( “abc” ).indexOf( “a” ) returns 0. Duh. Well only if you are a (non-Fortran) programmer. Ask a non-programmer (such as my wife) and they will say: 1, obviously. It is the first character. Duh. Excel FIND( “a”, “abc” ) returns 1.
Ok, most of my customers, aren’t programmers. I can use 1 based indexing.
But then things get more tricky.
What is the index of an empty string in “abc”? 1 maybe, using 1-based indexing or maybe empty is not a valid value to pass.
What is the index of an empty string in an empty string? Hmm. I guess the empty string does contain an empty string, but at what index? 1 maybe, using 1-based indexing, except there isn’t a first position in the string. Again, maybe empty is not a valid value to pass.
I looked at the Qt C++ QString, Javascript string and Excel FIND() function for answers. But they each give different answers and some of them aren’t even internally consistent. This is a simple comparison of the first index or last index of text v1 in text v2 in each (Excel doesn’t have an equivalent of lastIndexOf() that I am aware of):
Changing these to make the all the valid results 1-based and setting invalid results to -1, for easy comparison:
So:
Javascript disagrees with C++ QString and Excel on whether the first index of an empty string in an empty string is valid.
Javascript disagrees with C++ QString on whether the last index of an empty string in a non-empty string is the index of the last character or 1 after the last character.
C++ QString thinks the first index of an empty string in an empty string is the first character, but the last index of an empty string in an empty string is invalid.
It seems surprisingly difficult to come up with something intuitive and consistent! I think I am probably going to return an error message if either or both values are empty. This seems to me to be the only unambiguous and consistent approach.
I could return a 0 for a non-match or when one or both values are empty, but I think it is important to return different results in these 2 different cases. Also, not found and invalid feel qualitatively different to a calculated index to me, so shouldn’t be just another number. What do you think?
*** Update 14-Dec-2023 ***
I’ve been around the houses a bit more following feedback on this blog, the Easy Data Transform forum and hacker news and this what I have decided:
IndexOf() v1 in v2:
v1
v2
IndexOf(v1,v2)
1
aba
aba
1
a
a
1
a
aba
1
x
y
world
hello world
7
This is the same as Excel FIND() and differs from Javascript indexOf() (ignoring the difference in 0 or 1 based indexing) only for “”.indexOf(“”) which returns -1 in Javascript.
LastIndexOf() v1 in v2:
v1
v2
LastIndexOf(v1,v2)
1
aba
aba
4
a
a
1
a
aba
3
x
y
world
hello world
7
This differs from Javascript lastIndexOf() (ignoring difference in 0 or 1 based indexing) only for “”.indexOf(“”) which returns -1 in Javascript.
Conceptually the index is the 1-based index of the first (IndexOf) or last (LastIndexOf) position where, if the V1 is removed from the found position, it would have to be re-inserted in order to revert to V2. Thanks to layer8 on Hacker News for clarifying this.
Javascript and C++ QString return an integer and both use -1 as a placeholder value. But Easy Data Transform is returning a string (that can be interpreted as a number, depending on the transform) so we aren’t bound to using a numeric value. So I have left it blank where there is no valid result.
Now I’ve spent enough time down this rabbit hole and need to get on with something else! If you don’t like it you can always add an If with Calculate or use a Javascript transform to get the result you prefer.
*** Update 15-Dec-2023 ***
Quite a bit of debate on this topic on Hacker News.
Tabular data is everywhere. I support reading and writing tabular data in various formats in all 3 of my software application. It is an important part of my data transformation software. But all the tabular data formats suck. There doesn’t seem to be anything that is reasonably space efficient, simple and quick to parse and text based (not binary) so you can view and edit it with a standard editor.
Most tabular data currently gets exchanged as: CSV, Tab separated, XML, JSON or Excel. And they are all highly sub-optimal for the job.
CSV is a mess. One quote in the wrong place and the file is invalid. It is difficult to parse efficiently using multiple cores, due to the quoting (you can’t start parsing from part way through a file). Different quoting schemes are in use. You don’t know what encoding it is in. Use of separators and line endings are inconsistent (sometimes comma, sometimes semicolon). Writing a parser to handle all the different dialects is not at all trivial. Microsoft Excel and Apple Numbers don’t even agree on how to interpret some edge cases for CSV.
Tab separated is a bit better than CSV. But can’t store tabs and still has issues with line endings, encodings etc.
XML and JSON are tree structures and not suitable for efficiently storing tabular data (plus other issues).
There is Parquet. It is very efficient with it’s columnar storage and compression. But it is binary, so can’t be viewed or edited with standard tools, which is a pain.
Don’t even get me started on Excel’s proprietary, ghastly binary format.
Why can’t we have a format where:
Encoding is always UTF-8
Values stored in row major order (row 1, row2 etc)
Columns are separated by \u001F (ASCII unit separator)
Rows are separated by \u001E (ASCII record separator)
Er, that’s the entire specification.
No escaping. If you want to put \u001F or \u001E in your data – tough you can’t. Use a different format.
It would be reasonably compact, efficient to parse and easy to manually edit (Notepad++ shows the unit separator as a ‘US’ symbol). You could write a fast parser for it in minutes. Typing \u001F or \u001E in some editors might be a faff, but it is hardly a showstopper.
It could be called something like “unicode separated value” (hat tip to @fakeunicode on Twitter for the name) or “unit separated value” with file extension .usv. Maybe a different extension could used when values are stored in column major order (column1, column 2 etc).
Is there nothing like this already? Maybe there is and I just haven’t heard of it. If not, shouldn’t there be?
It has been pointed at the above will give you a single line of text in an editor, which is not great for human readability. A quick fix for this would be to make the record delimiter a \u001E character followed by an LF character. Any LF that comes immediately after an \u001E would be ignored when parsing. Any LF not immediately after an \u001E is part of the data. I don’t know about other editors, but it is easy to view and edit in Notepad++.
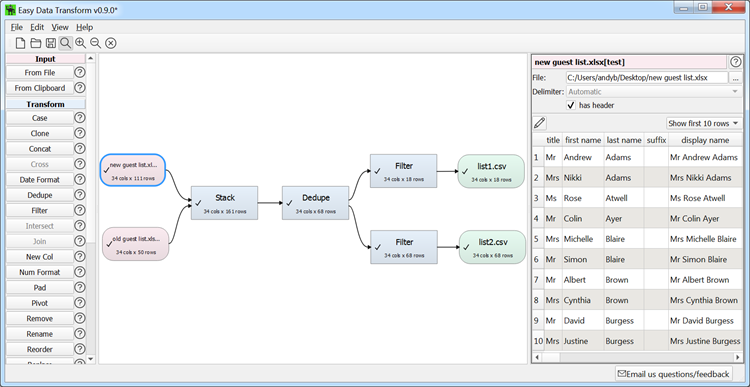
I have been furiously coding a new product. Easy Data Transform. It is a Windows and Mac tool for transforming table and list data from one form to another. Joining, splitting, reformatting, filtering, sorting etc.
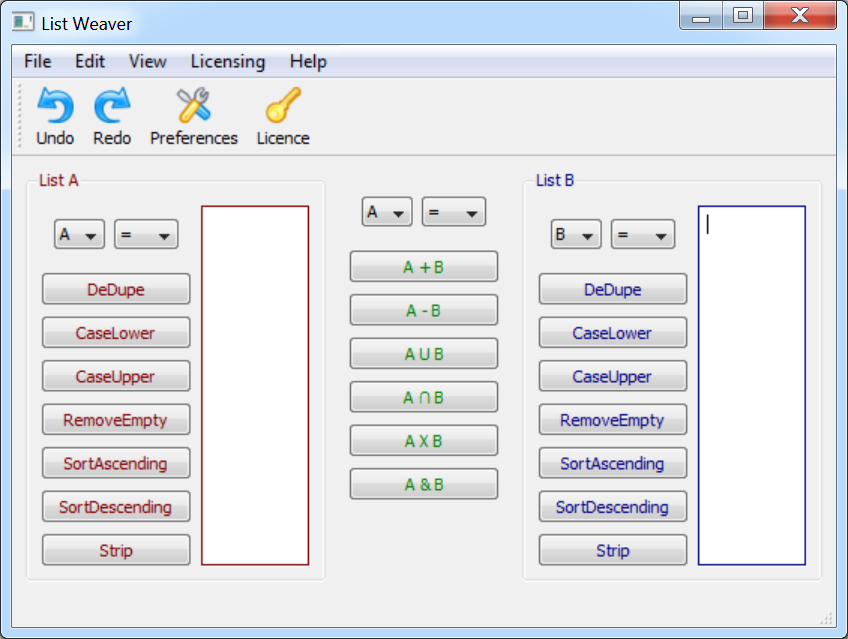
I have been thinking about this product idea for years. In fact I threw together a janky prototype back in 2008. It allows you to perform various operations on a pair of lists.
I used this prototype for jobs such as creating a list of emails of people who had bought Perfect Table Plan v5, but hadn’t upgraded to v6 yet. It worked. But it wasn’t very good. The biggest annoyance was that each operation obliterated everything that came before. Which made it very easy to lose track of where you had got to. And there was no repeatability. It was also limited to lists and it became clear that I really needed something that could also handle tabular data. I never released it.
But the idea has been running as a background process in my brain for 11 years since. And I think I have come up with a much better design in that time. Finally I had mature, stable versions of my Perfect Table Plan and Hyper Plan products out, so I decided to go for it. I am really pleased with how it has turned out so far.
If you aren’t embarrassed by v1.0 you didn’t release it early enough. And so I have cut lots of corners to get this first public version out. The documentation is only part written. I created the application icon myself in 10 minutes. There is no licensing. The GUI is lacking polish. The website would make a designer cry. But the software seems fairly robust. My 13 year old son wasn’t able to crash it after 10 minutes of trying, despite financial incentives to do so.
I did some market research and spoke to some people who knew a bit about this market. But I deliberately didn’t look closely at any competing products, as I didn’t want to be mentally restricted by what others have done. For better or worse, I want to blaze my own trail. Copying other people’s stuff is a zero-sum game with no net benefit to society.
Most of the things that Easy Data Transform you can do, you can also do in Excel or SQL. My claim is that it is much quicker, easier and less error prone to do in Easy Data Transform. No programming or scripting required. I am hoping that people will be able to start using it within a couple of minutes of downloading it (I plan to do lots of usability testing). Will people pay for that? I hope so. I’m not aiming it at programmers. Perish the thought.
Naming is hard. I came up with some 70 names. Things like ‘Data Hero’, ‘Transform Flow’, ‘Transmogrify’ and ‘Data Rapture’. But the domains were taken, people I asked hated them or there was an existing service or product with that name. So I ended up with Easy Data Transform. It does what it says on the tin.
Why desktop? Surely no-one is writing new desktop apps in 2019? I believe a desktop solution has some real advantages in this market. The biggest ones are:
You don’t need to load your (potentially highly sensitive) data on to a third party server.
Not having to upload and download (potentially very large) data sets makes it much more responsive.
Easy Data Transform is currently free for anyone to use. You can get it from the super-minimalist easydatatransform.com website. The current 0.9.0 version expires on the 4th August 2019. You will then be able to get another free version. Once the product is mature enough, and if I am convinced there is enough demand, I will release a paid version. The free beta will probably last several months. Please try it and let me know how you get on. I am particularly interested to get feedback from anyone using it for real day-to-day tasks.
Of course the real challenge is always marketing. How to get noticed amongst many competing products. As well as helping to improve the product I am hoping that this extended beta will also help me to get some traction and better understand the market. For example, what price to charge and what trial model to use. Watch this space.
Online businesses generate a lot of data. Sales data, marketing data, traffic data etc. Pivot tables can be a useful tool for analysing and extracting useful information from this sea of data. A lot of people seem to have heard of Pivot Tables without understanding what they are or how to use them. Despite the slightly cryptic name they are really just a way of summarizing tables of data. Nothing to be intimidated by. I’m going to try to demystify them here with a simple example.
Let’s imagine you have got an Excel spreadsheet with a month of (fictitious) sales transaction. It looks like this:
You want to find out:
The total value of sales of each product
The number of sales of each product
The total value of sales of each product by country
The total value of sales of each product by day of the week
How would you do it? You can crunch the numbers using a calculator, but that is very tedious and error prone. If you are a programmer you can export the data to a .csv file and write a small program in your favourite language to read it in, crunch the data and write the results out. You probably think you can do it in 10 minutes, but I bet it will take you at least an hour to get it working and debugged. I did all the above in 1 minute and 20 seconds using Excel pivot tables.
Here is how you can do it (screenshots from Excel 2007). You can download the spreadsheet if you want to try it yourself.
Select all the data, including the header (A1 to D222).
Click on Insert in the Excel Ribbon bar.
Click on PivotTable.
The Create Pivot Table window will appear. Click OK.
The PivotTable Field List will appear. We want to find the number of sales for each product. Drag the product field to Column labels and the value field to Values. This gives us the total value of sales by product.
To change this to the number of sales pull down the Sum of value drop-down list and select Value Field Settings….
Change Summarize value field by from Sum to Count and click OK.
The number of sales of each product are now shown.
Now drag the country field to Row labels. Then click on Count of value, select Value Field Settings…, change it back to Sum and click OK. The total value of sales of each product by country is now displayed.
We now need to add a day of the week column. Click on Sheet 1 and add a new column as shown.
Now select all the data from A1 to E222 and insert a new pivot table, as before.
Drag the fields as shown to get the total value of sales of each product by day of the week.
(We’ll quietly ignore the fact that the number of days aren’t divisible by 7 in the data.)
We can even display by product, day of the week and country with one more drag.
Excel also supports pivot charts if you prefer your results in graphical form.
Obviously this is a very simple example, but pivot tables can be used to quickly analyse much larger and more complex data sets. Next time you have got some data to analyse consider whether you would be better using pivot tables or pivot charts.
*** UPDATE ***
You can also use my Hyper Plan software to create pivot tables. It is a lot simpler than the above! There is a free trial.


 Online businesses generate a lot of data. Sales data, marketing data, traffic data etc. Pivot tables can be a useful tool for analysing and extracting useful information from this sea of data. A lot of people seem to have heard of Pivot Tables without understanding what they are or how to use them. Despite the slightly cryptic name they are really just a way of summarizing tables of data. Nothing to be intimidated by. I’m going to try to demystify them here with a simple example.


